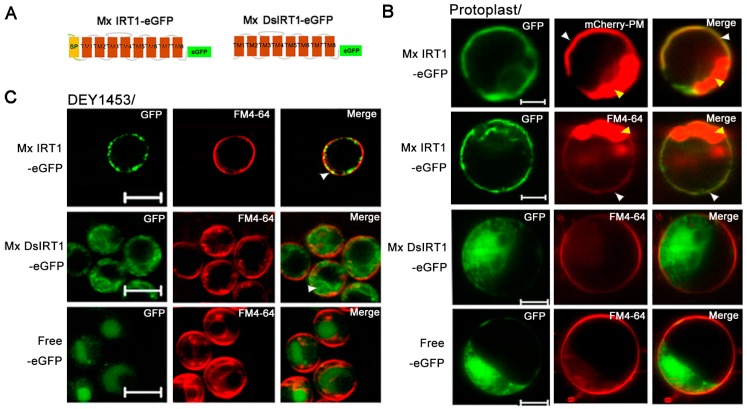
Figure 3.

Localization and protein detection of Mx IRT1-eGFP and Mx DsIRT1-eGFP. (A) Diagrams of the Mx IRT1-eGFP and Mx DsIRT1-eGFP fusion proteins constructs used for localization analysis; (B) Images showing fluorescence localization of Mx IRT1-eGFP (first and second rows); Mx DsIRT1-eGFP (third row); and control free eGFP (forth row) in transformed protoplasts. The mCherry-PM (red) (first row) and FM4-64 (red) (second row) were pointed by the white arrow; the merge signals (yellow) (first and second rows) were also indicated by the white arrow; the strong red signal comes from the chloroplast autofluorescence, indicated by the yellow arrow; (C) Localization pattern of Mx IRT1-eGFP (top row); Mx DsIRT1-eGFP (middle row); and free eGFP (bottom row) in transformed yeast lines; Scale bar: 5 μm; and (D) Analysis of the different fractions (1–7) from the density gradient. Detection of Mx IRT1-eGFP (left) and Mx DsIRT1-eGFP (right) fusion proteins by Western blot using a GFP and a Pma1p antibody (Pma1p as the intact membrane protein marker).

