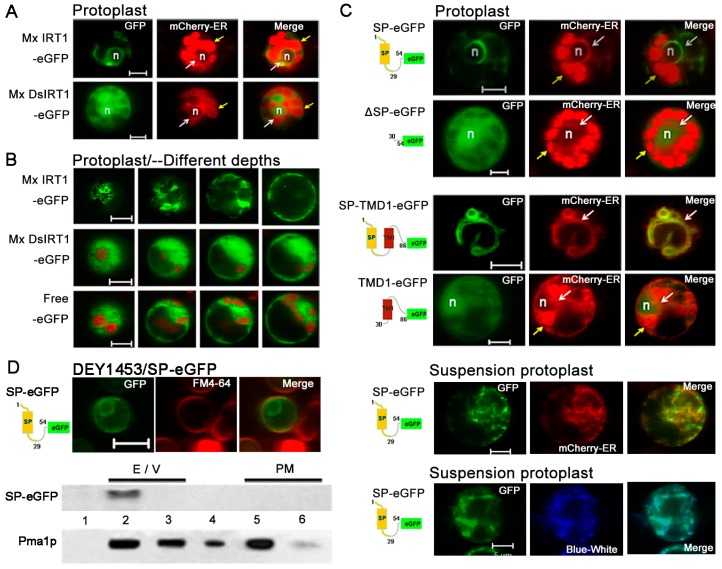
Figure 5.
Comparative confocal fluorescent imaging shows localization of different GFP fusion proteins with or without an N-terminal SP in rice protoplast. (A) Images showing co-localization of Mx IRT1-eGFP (green) and mCherry-ER (red) (top row), with co-localization as yellow in the merged panel (white arrows); Mx DsIRT1-eGFP did not co-localized with the mCherry-ER (red) (bottom row). The strong red signal comes from the chloroplast autofluorescence, indicated by the yellow arrow; (B) Images at different depths of scanning in 3 transformed protoplasts; (C) Fluorescent localization of SP-eGFP (1–54), ΔSP-eGFP (30–54), SP-TM1-eGFP (1–86), and TM1-eGFP (30–86) in leafy protoplasts (marked by mCherry-ER) and suspension protoplast (marked by mCherry-ER (red) and ER- tracker Blue-White (blue)); and (D) Intracellular localization of SP (1–54)-eGFP in yeast; and western blot analysis of the ER/Vacuole (indicated by 2 and 3) and PM fractions (indicated by 5 and 6) from SP-eGFP transformed yeast using the GFP and Pma1p- antibodies. Scale bar: 5 μm. Note: The ER marker appears at a low intensity of red fluorescence, as indicated by the white arrow in A and C; the strong red signal comes from the chloroplast autofluorescence, as indicated by the yellow arrow. Scale bar: 5 μm; n: nucleus.

