Figure 3.
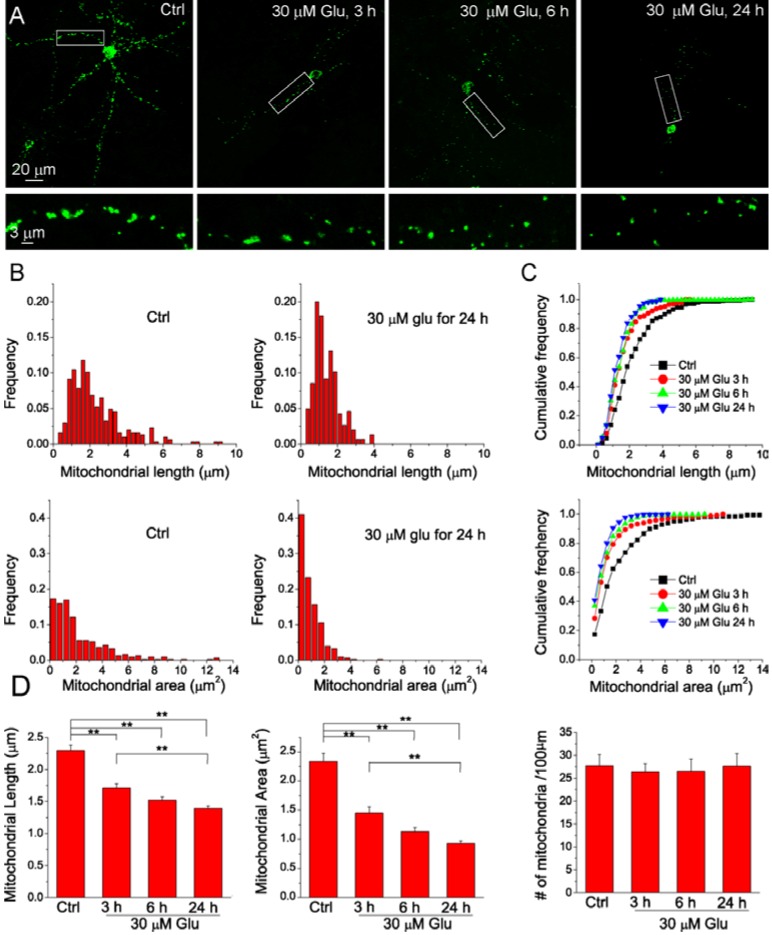
The time course of mitochondrial fragmentation after glutamate stimulation. (A) Maximal projection confocal images of primary cortical neurons transfected with mito-AcGFP1. Neurons were treated without or with 30 μM glutamate together with 3 μM glycine for 3, 6 and 24 h, respectively. The lower panels are the high resolution images of the boxed region in upper panels. The images at different time points were acquired from different neurons; (B–C) Frequency distribution and cumulative curves of mitochondrial length and area under different conditions. The values of histogram intervals (bins) are 0.25 μm for mitochondrial length and 0.5 μm2 for mitochondrial area. Distribution data showed that glutamate treatment caused significant increase in the number of shorter and smaller mitochondria and this effect was dependent on treatment time; (D) The summary of average mitochondrial length, area and density for each condition. Data are shown as mean ± SE; ** p < 0.01, ANOVA test. Data were collected from 10–11 neurons grown on two glass coverslip per experimental condition and a total of 1169 mitochondria were measured.

