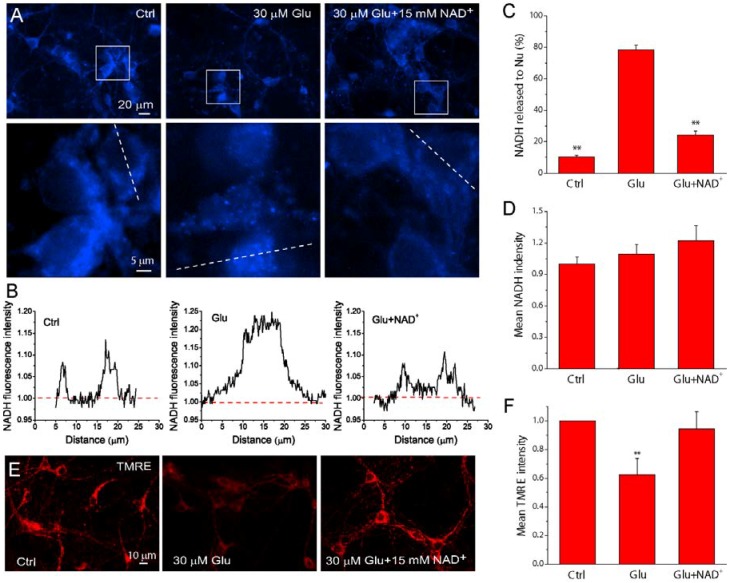
Figure 6.
NAD+ preserves mitochondrial functional integrity after glutamate excitotoxicity. (A) Representative images of NADH auto-fluorescence under different conditions using fluorescence microscopy. The lower panels are the high resolution images of the boxed region in upper panels; (B) Line-scan of NADPH fluorescence from neurons indicated in (A), showing the localization of NADPH under different condition. The fluorescence was normalized to the background. Notice from (A,B) that glutamate stimulation caused NADH release from mitochondria and the concentration of NADPH in the nuclei; (C,D) The percentage of neurons with NADH localized in nuclei (C) and the average fluorescence intensity normalized with cell number in the field (D) under different conditions; (E,F) TMRE images of neurons (E) and the average fluorescence intensity normalized with cell number (F) with different treatments. The reduction of TMRE fluorescence indicated the loss of MMP. Results are shown as mean ± SE. For each condition, 5–8 fields were randomly chosen from 2 coverslips in 3–5 independent experiments. Primary mouse cortical neurons were stimulated by 30 μM glutamate together with 3 μM glycine for 24 h in the presence and absence of 15 mM NAD+. ** p < 0.01 versus Ctrl and Glu + NAD+, ANOVA test.

