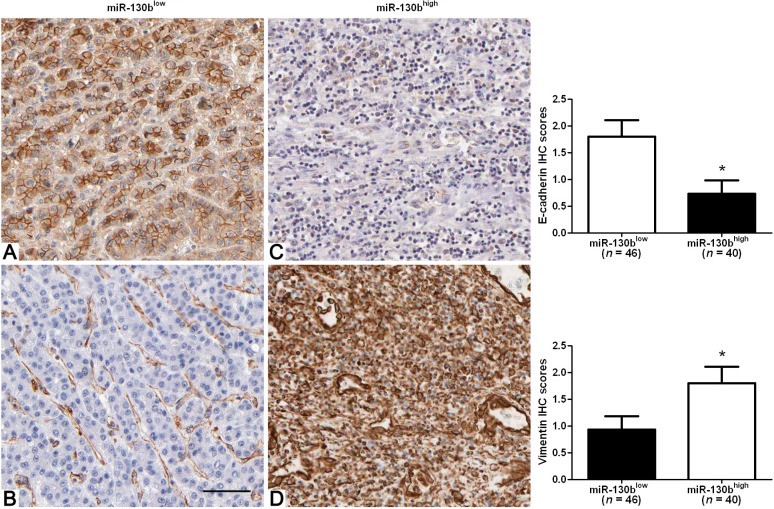
Figure 2.
Immunohistochemical analysis of E-cadherin and Vimentin in HCC samples. In cases of low miR-130b expression (A,B); there was strong E-cadherin and no detectable Vimentin protein expression in the same tissue section. In contrast, in the case of high miR-130b expression (C,D), there was no detectable E-cadherin and strong Vimentin protein expression. Values are depicted as Mean ± SEM; * p < 0.05 by t test. Scare bar = 100 μm.

