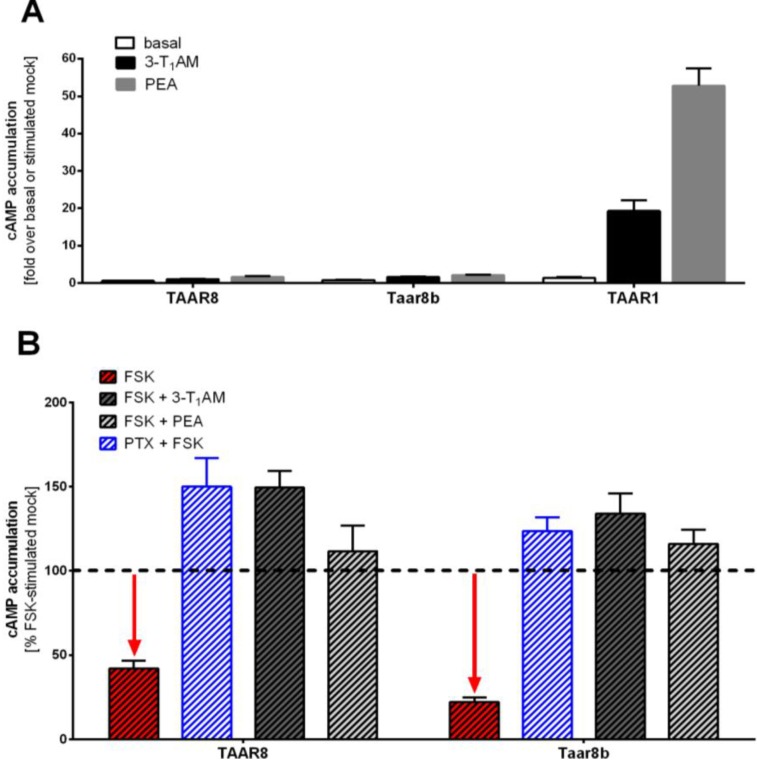
Figure 4.
cAMP accumulation after Gs and Gi/o coupling, respectively. HEK293 cells were stimulated with either 3-T1AM (black) or PEA (grey) for determination of potential Gs signaling (A) or co-stimulated with forskolin (FSK) and 3-T1AM (dark grey, hatched), PEA (light grey, hatched) or pertussis toxin (PTX) (blue hatched), for determination of potential Gi/o signaling (B). Accumulation of cAMP was determined by AlphaScreen technology as described in the methods section. Data are represented as mean ± SEM of cAMP accumulation in fold over basal or stimulated mock-treated cells, based on two to seven independent experiments, each performed in triplicate. (A) Mock-transfected cells showed basal cAMP levels of 0.71 ± 0.13 nM. The human TAAR1 served as a positive control; (B) Mock-transfected cells demonstrated basal cAMP levels of 18.5 ± 1.1 nM. Murine and human TAAR8 showed basal Gi/o coupling activity, indicated by a low basal cAMP accumulation compared to mock transfected cells (dotted line = mock 100% baseline) and by increased cAMP accumulation following pre-incubation with PTX and stimulation with FSK.

