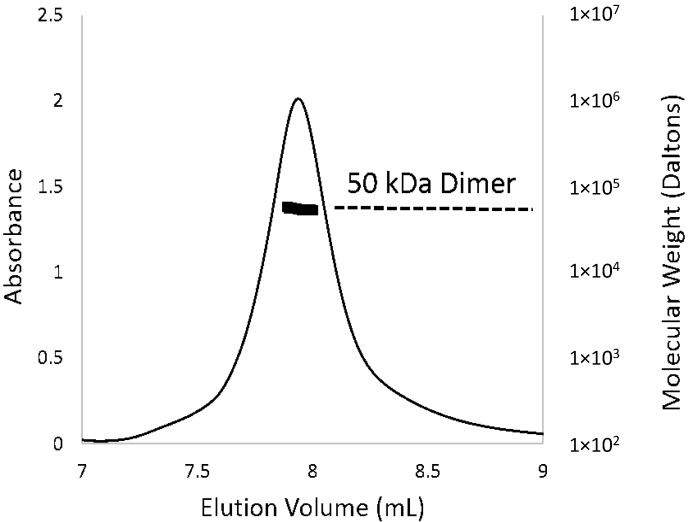
Figure 3.
Oligomeric state of PcpR in solution. The elution profile for PcpR was monitored with multi-angle laser light scattering and was shown as absorbance (left-Y axis) and molecular weight (right-Y axis) versus elution volume (mL). The solid line represents changes in absorption at 280 nm. The thick black cluster in the middle of the peak indicated the calculated molecular mass (~50 kD) from the light scattering illustrating the dimeric nature of PcpR.

