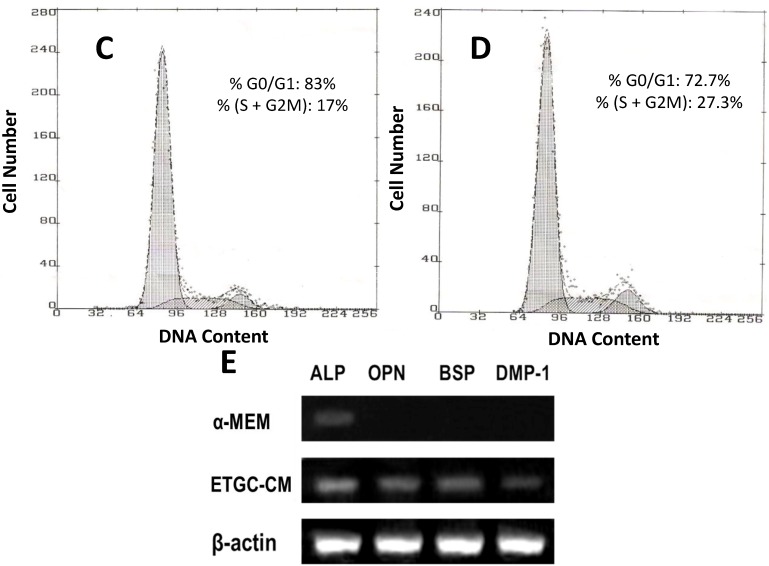
Figure 9.
Odontogenic differentiation of GMSCs after two weeks of induction. (A) Representative images of embryonic Sprague-Dawley rats; (B) Representative images of tooth germ cells (TGCs). Representative cell cycle distribution graphs of GMSCs cultured with α-MEM (C) and ETGC-CM (D) for eight days; and (E) The expression of odontogenic genes detected by RT-PCR.


