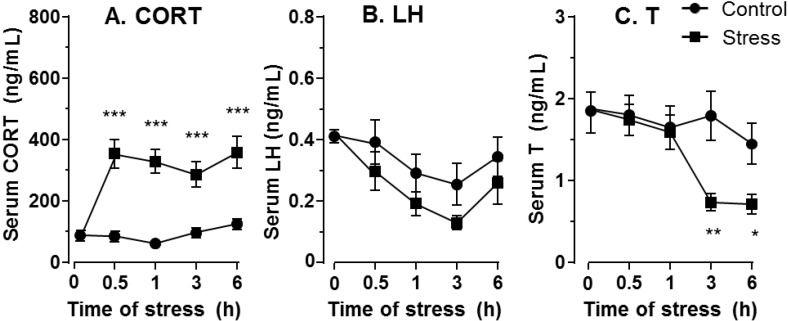
Figure 1.
Plasma corticosterone (CORT), luteinizing hormone (LH) and testosterone (T) levels during the course of stress. (A) Plasma CORT; (B) Plasma LH; and (C) Plasma T levels. Mean ± SEM (n =12–25, each time point). n = 12 for 0 h group, in which animals of the control and stress group were calculated together. *, ** and *** indicate significant difference compared to control (unstressed) at each time point at p < 0.05, p < 0.01 and p < 0.001, respectively.

