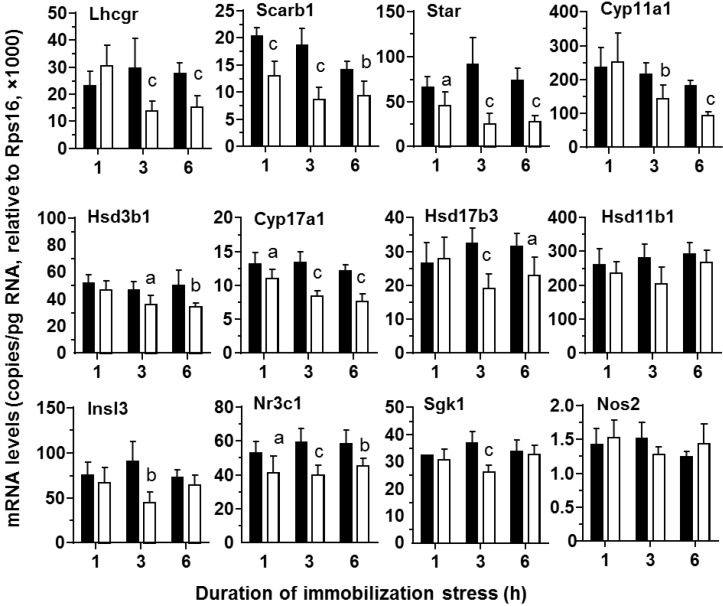
Figure 4.
Messenger RNA levels of testes from control and stressed rats during the course of immobilization stress. Control (black bar) and immobilization stress (white bar). Mean ± SEM (n = 6). Letters a, b, and c indicate significant difference compared to the control at each time point at p < 0.05, p < 0.01 and p < 0.001, respectively.

