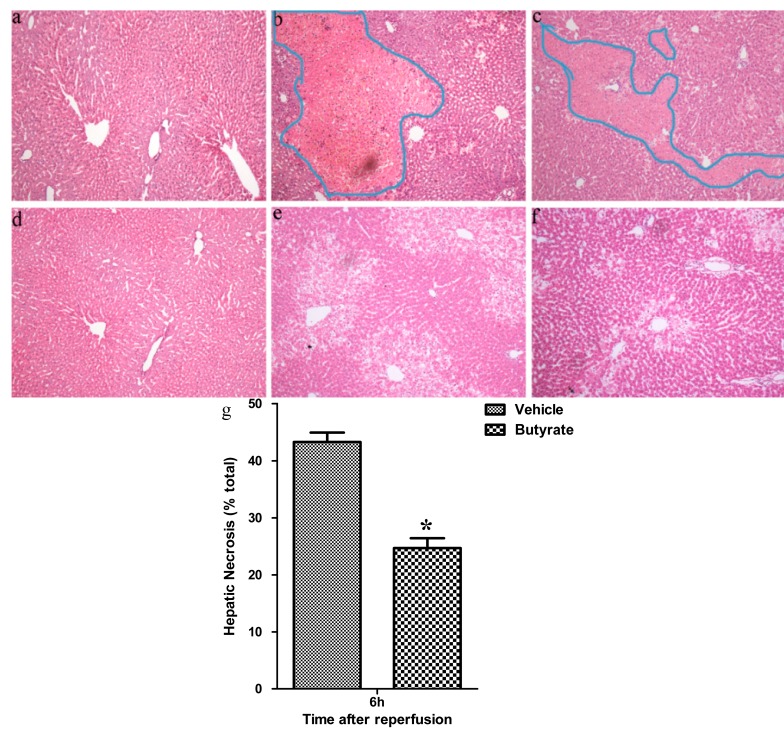
Figure 2.
Hematoxylin–eosin (HE)-stained liver sections from the sham (a,d); vehicle (b,e); and butyrate (c,f) groups at 6 h (a–c) and 24 h (d–f) after reperfusion (original magnification: 200×), with the outlined areas in the blue line (b,c) showing hepatic necrosis area (g). Severe liver injury indicated by hepatocellular necrosis, sinusoidal congestion, and neutrophil infiltration was present in the vehicle group, whereas less damage was noted after butyrate treatment. * p < 0.05 vs. the vehicle group.

