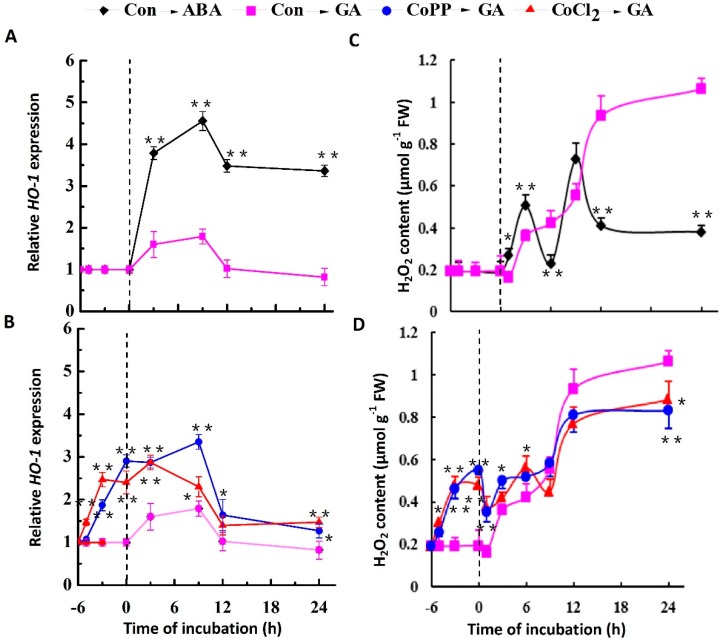
Figure 3.
Induction of HO-1 gene expression and H2O2 production in response to cobalt. Wheat aleurone layers were pretreated with distilled water (Con), 50 μM CoCl2 or 50 μM CoPP for 6 h (marked as “6” on the graph), and then transferred to a medium containing 5 mM CaCl2 and 50 μM GA or ABA. Wheat HO-1 transcripts (A,B) and H2O2 content (C,D) were measured at the indicated time points. Data are the means ± SD of three independent measurements from different experiments. Within the same treatment time points, bars with asterisks are significantly different as compared with corresponding GA-alone samples, according to Student’s t-tests (* p < 0.05 and ** p < 0.01).

