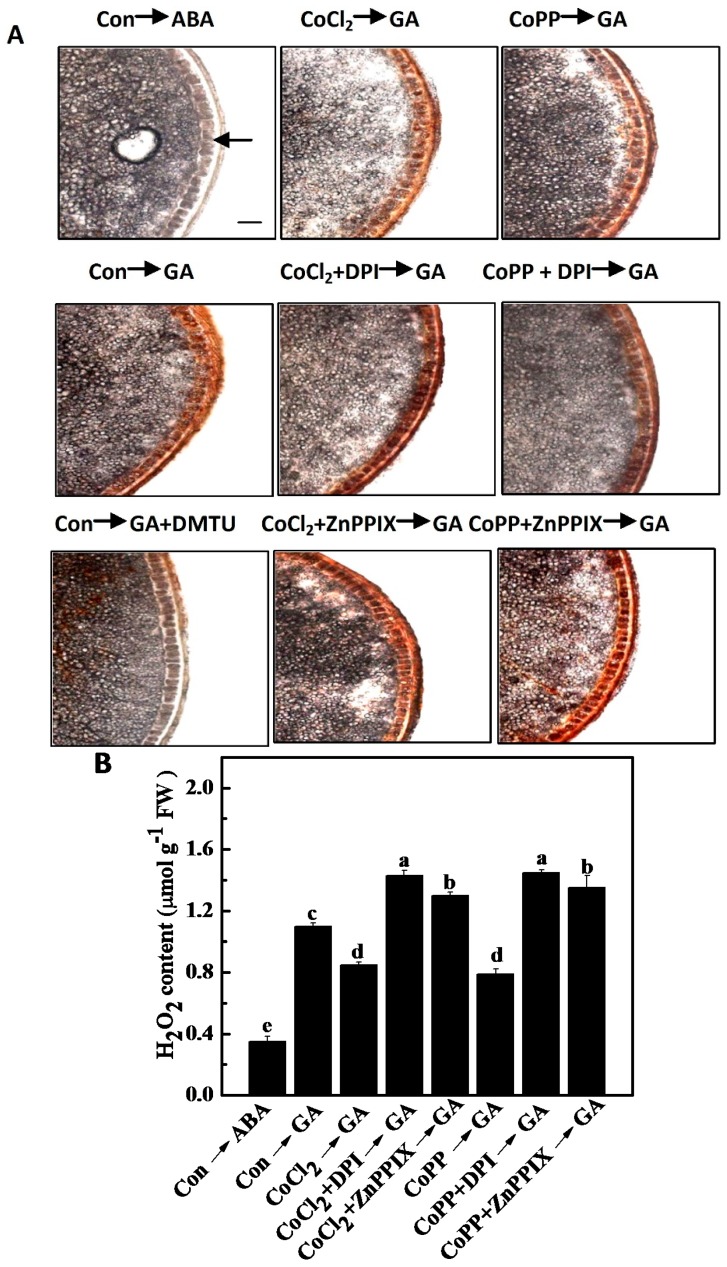
Figure 8.
Production of H2O2 in wheat aleurone layers. Wheat aleurone layers were pretreated with distilled water (Con), 50 μM CoCl2 or 50 μM CoPP, 10 μM DPI, 100 μM ZnPPIX alone or a combination for 6 h and then transferred to a medium containing 5 mM CaCl2 and 50 μM ABA or GA. (A) After 24 h of incubation, samples were incubated with DAB (1 mg/mL) for 1 h. Arrows in the picture indicate aleurone layers. Scale bar = 50 μm; (B) H2O2 content was measured spectrophotometrically. Data are the means ± SD of at least three independent measurements from different experiments. Within each set of experiments, bars denoted by different letters are significantly different at p < 0.05, according to Duncan’s multiple tests.

