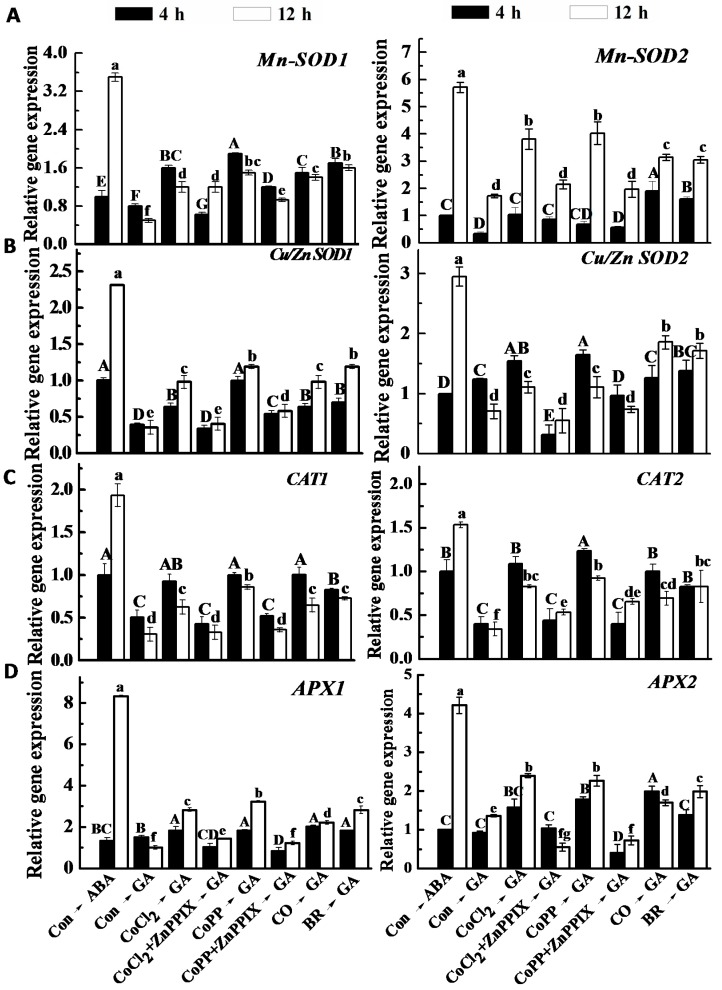
Figure 10.
Expression patterns of antioxidant genes. Wheat aleurone layers were pretreated with distilled water (Con), 50 μM CoCl2, 50 μM CoPP, 1% CO aqueous solution, 10 μM bilirubin (BR), 100 μM ZnPPIX alone or a combination for 6 h and then transferred to a medium containing 5 mM CaCl2 and 50 μM GA or ABA, respectively. Mn-SOD1/2 (A), Cu/Zn SOD1/2 (B), CAT1/2 (C) and APX1/2 (D) transcripts were measured at the indicated time points. The expression levels of the genes are presented as values relative to ABA alone-treated samples (4 h). Data are the means ± SD of at least three independent measurements from different experiments. Within each set of experiment, bars denoted by different letters are significantly different at p < 0.05, according to Duncan’s multiple test.

