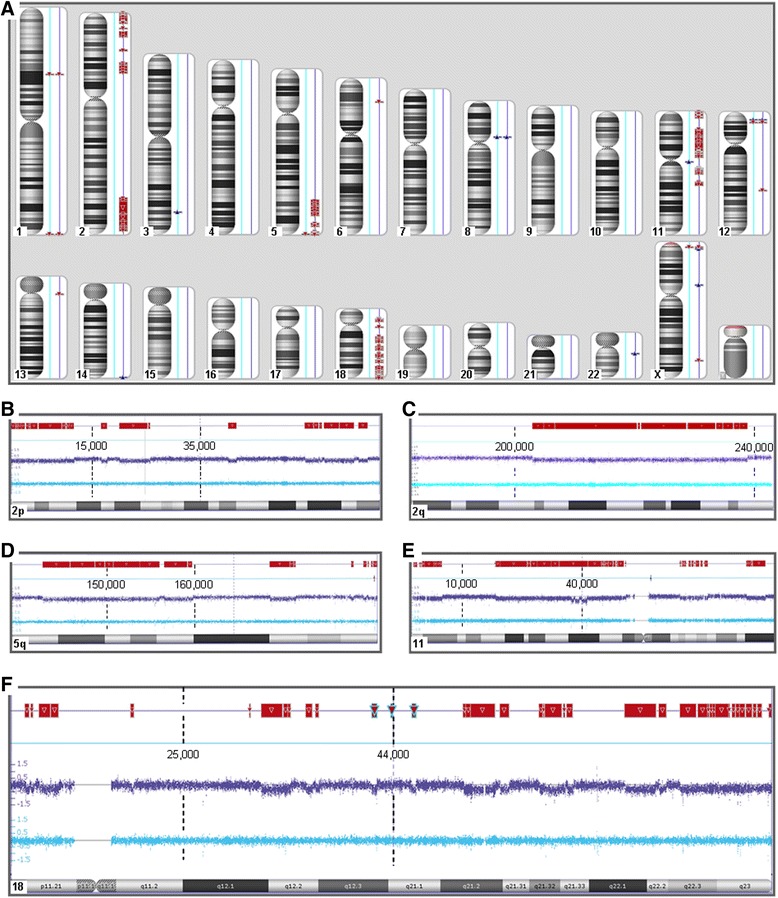
Figure 2.

Leiomyoma (#708) with extended copy number alterations confined to four distinct chromosomal regions and the whole chromosome 18, respectively. A: Genomic view of the case showing for each chromosome the ideogram, the myometrial tissue (light blue line), and the leiomyomas (dark blue line). Red blocks represent deletions. B-F: Detailed view of the five parts of the genome showing numerous losses, i.e. 2p14 → 2pter, 2q33.1→2qter, 5q31.3→5qter, 11q14.1→11qter, and 18p11.21→18q22.3. Within each diagram the two lines above the ideogram represent myometrial tissue (light blue) and the leiomyoma (dark blue), respectively. Dashed lines and numbers represent the map positions according to Hg19 (NCBI Build 37 reference sequence). In the top line, the positions of deletions are shown as red blocks.
