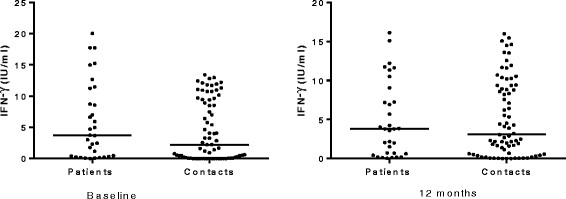
Figure 2.

Comparison of the median levels of IFN-γ between patients (n = 32) and contacts (n = 74) at baseline and 12 months. Mann-Whitney test was used to analyze the data. Each filled circle represents a participant and horizontal solid lines represent medians. There was no statistically significant difference in the median levels of IFN-γ between patients and contacts both at baseline and 12 months later.
