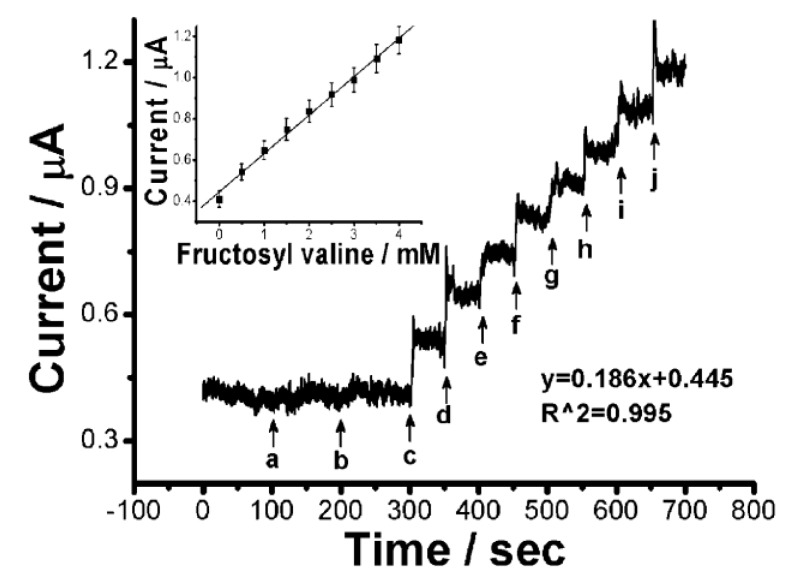
Figure 8.
Amperometric response of FcBA to glucose and FV. The output current was recorded at 0.1 V vs. Ag/AgCl. 1 mM glucose (a,b) and 0.5 mM FV (c–j) were added to the sample solution. (Inset) A calibration graph for FV. Reprinted with permission from Chien et al. [24]. Copyright (2011) Wiley-VCH Verlag GmbH & Co.

