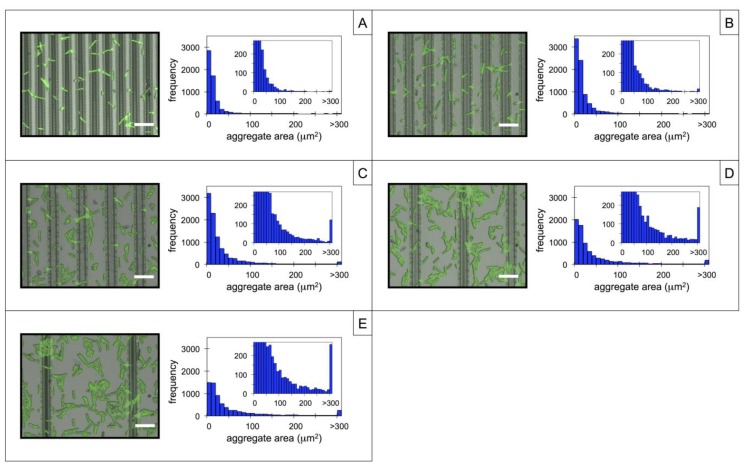
Figure 2.
Composite brightfield-fluorescence images (100×) and corresponding histogram plots of surfaces containing PGMA-b-PVDMA films patterned as line arrays with a pitch of (A) 7 µm, (B) 10 µm, (C) 15 µm, (D) 25 µm, and (E) 45 µm after WGA functionalization and microbe incubation. Aggregate sizes were measured over a 2.0 mm2 area for each line array. Histogram insets are zoomed-in plots showing the frequencies of the larger aggregates. Scale bar = 10 µm in all images.

