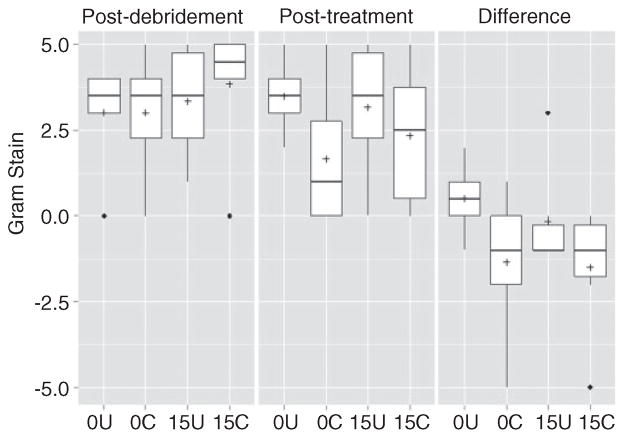
Figure 6.
Analysis based on average Gram stain scores. Results are shown for each experimental group immediately following debridement, after treatment, and as the change between these two time points. None of the differences observed by Gram stain were statistically significant. 0U and 0C refer to uncoated and coated pellets, respectively, while 15U and 15C refer to uncoated and coated pellets containing daptomycin. Boxes indicate the 25th and 75th percentiles for each group and define the IQR, with the horizontal line indicating the median. Vertical lines define the lowest and highest data points within 1.5 IQR of the lower and higher quartiles, respectively, with individual dots representing single data points outside this range. Numbers within the graph are p values determined as described in the text.

