
Figure 2.
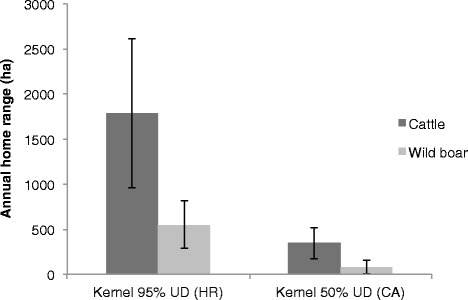
Comparison of mean annual domestic cattle and wild boar home ranges. Home range sizes (ha) derived using fixed-kernel density estimators for 95% utilization distribution (UD) and 50% UD. Kernels were estimated using data from 12 cattle and 18 wild boar GPS-collared between July 2011 and October 2013 in Doñana National Park, Spain. Error bars indicate SE.