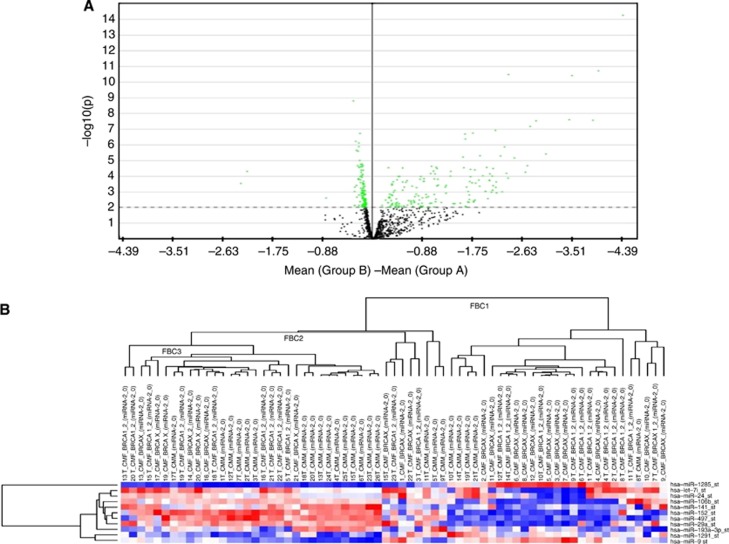
Figure 1.
Representation of miRNAs deregulated in male and female cases. (A) The volcano plot shows the global trend of deregulated miRNAs. The X axis represents the difference between miRNA mean expression level in male (group B) and female (group A) cases. Significant miRNAs are located above the dotted line (green points) that indicates log10 (cutoff P-value) considered in the statistical analysis: P<0.01. (B) The heatmap shows three sample clusters (FBC1, FBC2 and FBC3). FBC2, which included fMBC named in the figure CMM, showed a different miRNA deregulation with respect to fFBC named CFM (FBC1 and FBC2). The miRNA overexpression is in red, and lower miRNA expression is in blue.

