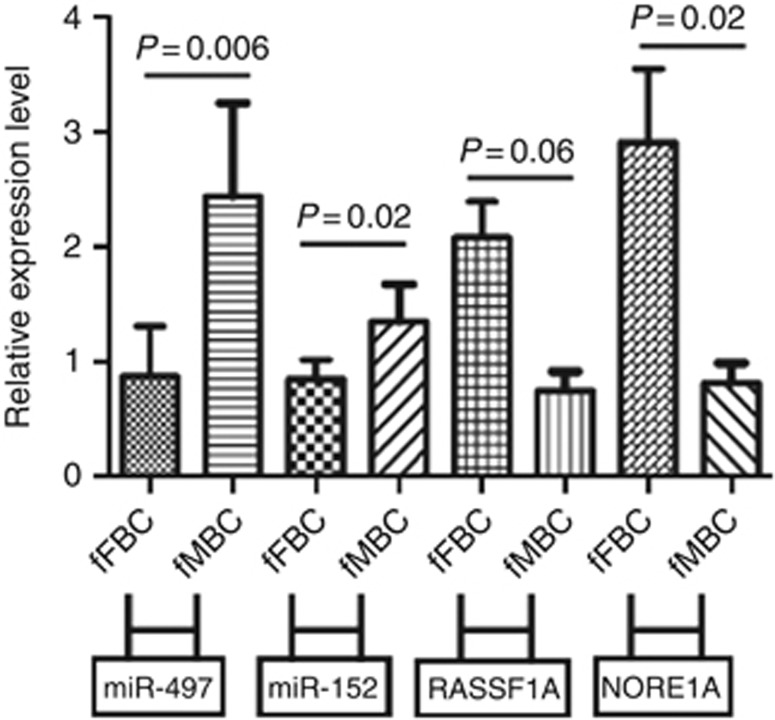
Figure 2.
Relative expression levels of miR-152, miR-497, RASSF1A and NORE1A in fMBC and fFBC. Relative expression levels for every sample were determined by real-time PCR and calculated by normalising with respect to the expression level of RNU48. The statistical significance of differences between fFBC and fMBC was calculated using the Mann–Whitney U-test. Bars indicate median values with interquartile range.

