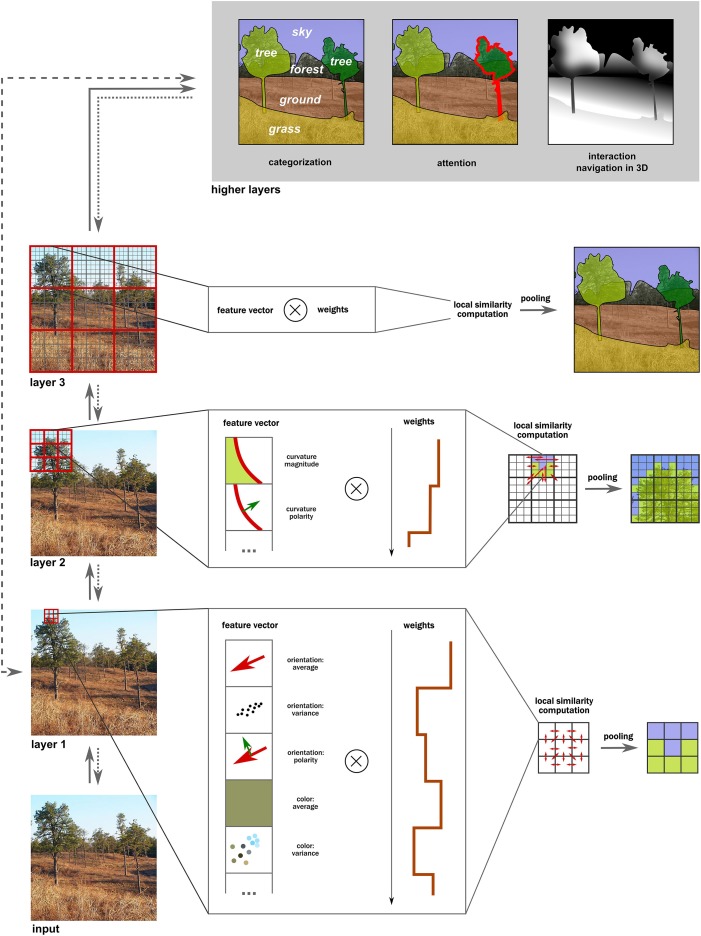
Figure 6.
Computation of intermediate representations in the visual hierarchy. In each layer, various features are extracted first at each location, forming a feature vector. Next, correlations are computed in the local neighborhood between each pair of a weighted feature pair, leading to similarity statistics (red arrows). (The optimal weights need to be learned by training the model.) Finally, these patches are pooled together into clusters that contain similar statistics. These new clusters are used in the next layers for the same similarity and pooling over increasingly larger neighborhoods. Note how the resulting intermediate representations are interpolated behind occlusions and are ordered in depth (e.g., the tree is in front of the forest). These representations can now be used for higher-level tasks such as categorization, attention to specific objects or interaction with them, or for navigation. They are also rather coarse initially (e.g., trees on the right are incorrectly lumped together), and can further be refined iteratively via feedback loops (if attention is directed to that region). Moreover, notice that not all steps must necessarily be carried out as certain shortcut routes (e.g., the gist computation) using simpler statistics can occur.

