
Figure 12.
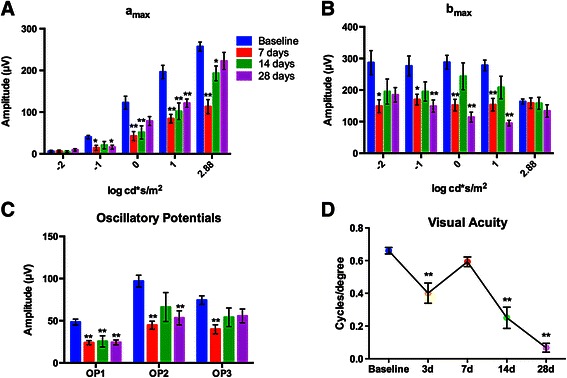
Blast wave exposure causes early and late visual deficits. (A) Bar graph of the electroretinogram (ERG) amax over light intensity. An early decrease in the amax recovers over time. (B) Bar graph of ERG bmax over light intensity. The bmax recovers by 14 days post-blast wave exposure then decreases again at 28 days post-blast wave exposure. (C) Bar graph of the oscillatory potential (OP) peak amplitude at each time point. The OPs are decreased at seven and 28 days post-blast wave exposure. (D) Photopic spatial threshold (visual acuity) is significantly decreased at three, 14 and 28 days post-blast wave exposure. *P <0.05, **P <0.01. Error bars represent SEM for each graph.