
Figure 8.
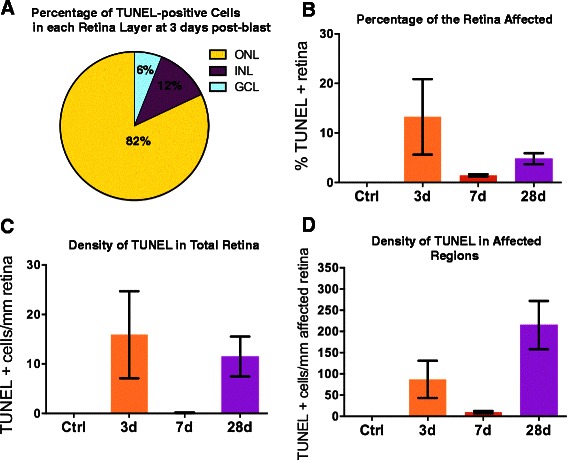
Cell death occurs in two waves after blast wave exposure. (A) Pie chart showing the distribution of TUNEL-positive cells through the retinal layers after blast wave exposure. (B) The percentage of total retina containing TUNEL-positive cells at each time point. (C) The average number of TUNEL-positive cells per mm total retina after blast wave exposure. (D) The average number of TUNEL-positive cells per mm within the affected areas after blast wave exposure. Error bars represent SEM for each time point. GCL = ganglion cell layer; INL = inner nuclear layer; ONL = outer nuclear layer.