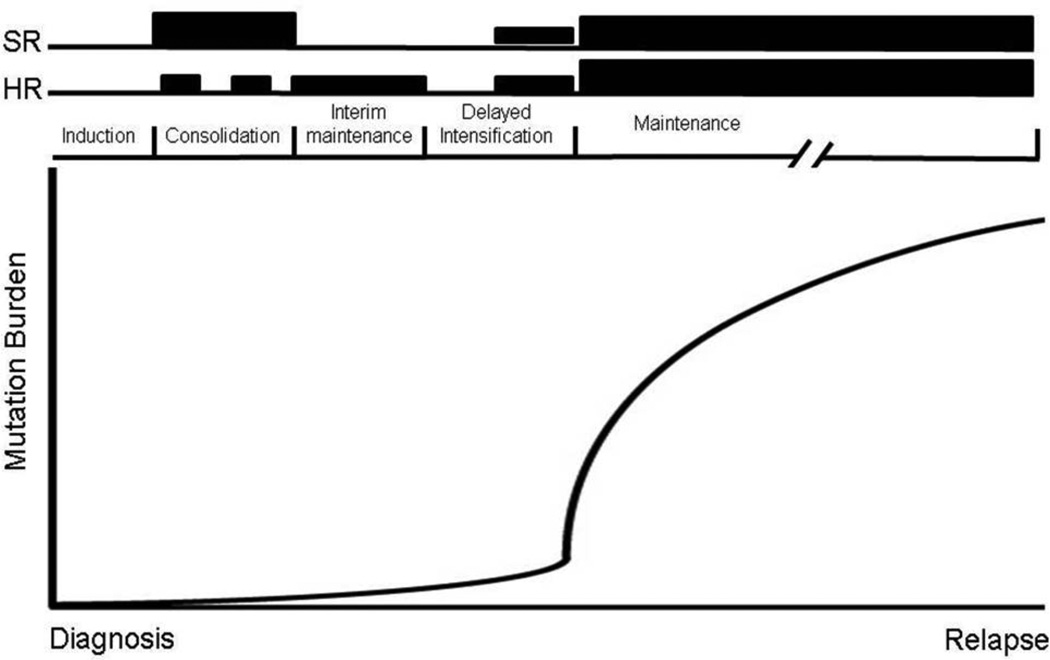
Figure 3. Schematic representation of purine nucleoside analogue therapy during ALL treatment.
SR (standard risk) and HR (high risk) back bones are shown above with height of the bars representing relative amounts of 6MP/6TG used during treatment cycles. The solid line represents theoretical outgrowth of NT5C2 mutant clones during maintenance therapy leading to relapse disease.

