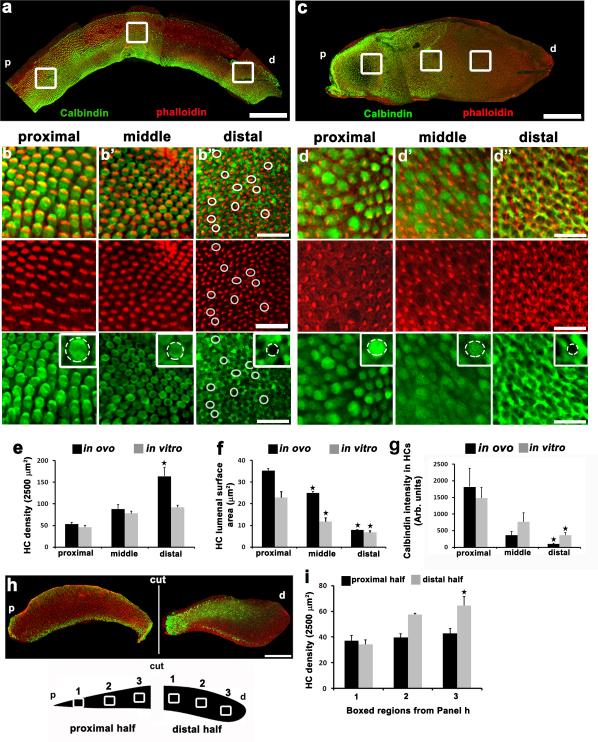
Figure 1. Tonotopic organization in the chick basilar papilla develops normally in vitro.
(a) Maximum z-projection of anE12 BP labeled with anti-Calbindin (green) and phalloidin (red)illustrating frequency-specific differences in cell morphology along the tonotopic axis. Proximal (p) and distal (d) ends are indicated. White boxes indicate regions used for zoomed images illustrated in b, b’ and b”. Top panel shows merged calbindin and phalloidin channels. White circles highlightrepresentative hair cells. Middle panel shows phalloidin-labeled stereocilia bundles highlighting the tonotopic differences in hair cell size and number. Lower panels show calbindin fluorescence in hair cells at the same BP regions. Note limited or no expression of Calbindin in hair cells (white circles) in b” . Insets: High magnification views of individual hair cell surfaces. .(c)Maximum z-projection of acontrol BP explant, labeled as in a,established at E6.5 and maintained for 6 days in vitro (IV). As for b-b”, panels illustrate changes in stereocilia size and density and Calbindin expression along the tonotopic axis.(e,f,g)Mean hair cell density, lumenal surface area and Calbindin intensity in hair cells in theindicated regions of the BP for samples maintained in ovo (black) or in vitro (grey). In all cases, a gradient is present along the tonotopic axis both in ovo and in vitro. For e, f and g, data are mean ± sem. Stars indicate a p value < 0.05 relative to the proximal value within the same group, based on Student's t-test. (h)Tonotopy is specified before E7.0. Calbindin (green) and phalloidin (red) labeling in proximal (p) and distal (d) halves from an E6.5 BP that was separated at the time of dissection and maintained for 6 days IV. The proximal-to-distal gradient ofCalbindin expression is present in the distalhalf. In contrast, Calbindin expression is almost completely absent in the proximal explant. (i)Quantification of hair cell density from specific regions (see cartoon in h) along proximal and distal explants halves. A gradient of hair cell density is present in distal explants but no change in density is present in proximal explants.Data are mean ± sem. Star indicates a p value < 0.05 relative to box 1, Student's t-test. For panel e, n=9 for both conditions, for panel f, n=8 for both conditions, For panel g, n=80 cells for each position measured from 4 separate experiments.Scale bars are 100 μm.

