

Abstract
Introduction and hypothesis
Pelvic floor muscles (PFM) are deleteriously affected by vaginal birth, which contributes to the development of pelvic floor disorders. To mechanistically link these events, experiments using animal models are required, as access to human PFM tissue is challenging. In choosing an animal model, a comparative study of PFM design is necessary, since gross anatomy alone is insufficient to guide the selection.
Methods
Human PFM architecture was measured using micromechanical dissection and then compared with mouse (n=10), rat (n=10), and rabbit (n=10) using the Architectural Difference Index (ADI) (parameterizing a combined measure of sarcomere length-to-optimal-sarcomere ratio, fiber-to-muscle-length ratio, and fraction of total PFM mass and physiological cross-sectional area (PCSA) contributed by each muscle). Coccygeus (C), iliocaudalis (IC), and pubocaudalis (PC) were harvested and subjected to architectural measurements. Parameters within species were compared using repeated measures analysis of variance (ANOVA) with post hoc Tukey's tests. The scaling relationships of PFM across species were quantified using least-squares regression of log-10-transformed variables.
Results
Based on the ADI, rat was found to be the most similar to humans (ADI = 2.5), followed by mouse (ADI = 3.3). When animals' body mass was regressed against muscle mass, muscle length, fiber length, and PCSA scaling coefficients showed a negative allometric relationship or smaller increase than predicted by geometric scaling.
Conclusion
In terms of muscle design among commonly used laboratory animals, rat best approximates the human PFM, followed by mouse. Negative allometric scaling of PFM architectural parameters is likely due to the multifaceted function of these muscles.
Keywords: Pelvic muscles, Muscle architecture, Animal model
Introduction
Pelvic floor trauma is a serious and common consequence of vaginal childbirth and is the greatest risk factor for the development of pelvic floor dysfunction. Each year in the United States, the cost of pelvic floor disorders (PFD) exceeds US $1 billion, with more than 300,000 patients requiring surgery [1]. Trauma to the pelvic floor muscles (PFM) appears to play an important role in the pathogenesis of PFD. Defects in the levator ani complex have been demonstrated in a third of women after spontaneous vaginal delivery and in 60 % after forceps-assisted deliveries [2]. The risk of developing PFD is dramatically increased in women in whom avulsions of the PFM are present on imaging studies when compared with women with intact PFM [3]. Despite this association, the baseline structure and function of the PFM and changes that cause PFD are poorly understood. To mechanistically link childbirth and associated PFM injury as a cause of development of PFD decades later, unaffected and affected muscle properties must be studied over long periods of time with repeated measures. Such studies in humans are challenging, as ethical issues surround the procurement of human PFM tissue. This is particularly problematic in studies of muscle architecture that require access to the entire muscle. Thus, the use of animal models is essential to understand the relationship between pregnancy-induced adaptations and/or maternal birth injury on PFM structure and function.
The major structures involved in proper pelvic floor functioning include the vagina and vaginal supportive tissue complex, pelvic floor skeletal muscles, and intact innervation. Pregnancy and maternal birth injury can have deleterious effect on these various components of the pelvic floor support system, leading to the development of PFD. The focus of this research is on the skeletal PFM.
Various animal species are used in PFD research. Pelvic muscles (PM) of nonhuman primates (NHP) are considered the best model given their more upright posture and analogous function of levator ani muscles [4]. However, NHP research is extremely expensive and logistically challenging, precluding many investigators from being able to use this animal model. Given that the gross intrapelvic skeletal muscle organization of rodents and rabbits are similar to humans, it would be helpful to determine which (if any) of these species is most similar to humans in terms of pelvic anatomical design. Gross anatomy alone is insufficient to guide the selection. Since the best predictor of muscle function is its architecture, comparisons across species should be based on a muscles' architectural similarity [5]. While muscle mass and fiber-type distribution do impact its properties, they are not very good predictors of muscle function. A number of anatomical and functional studies have been performed to determine structural factors that are the strongest predictors of muscle function (i.e., force and excursion) [5]. The structural property that best predicts a muscle's force-generating and moving capacity, determined by its active range of contraction (excursion) and how fast it contracts (velocity), is its architecture [5–7]. In vivo, a muscle appears to adjust its fiber length (or architecture) in order to maximize force production under its functional conditions. Thus, determining the impact of pregnancy and delivery on PFM architecture can add to the understanding of mechanisms of injury to these muscles due to parturition. Muscle architectural properties include length muscle (Lm) fiber length (Lf), physiological cross-sectional area (PCSA), and sarcomere length [5]. Muscles that have a large PCSA and short fiber length are optimized to generate force, whereas muscles with a small PCSA and long fiber length are designed to maximize excursion. The sarcomere length of a muscle determines the force it generates when stimulated [8], where at its optimal length a muscle generates the highest force. We reported the architecture of the individual components of human deep PFM: coccygeus (C), iliococcygeus (IC), and pubovisceralis (PC) [9]. Given these reference human data, we conducted a comparative study of PM architecture.
In addition to architecture, it is important to define how muscle properties scale among different-sized animals. Allometry is the study of size and its consequences [10, 11]. Scaling comparisons among species of different sizes allow us to examine how body mass affects muscle design. If body mass is the main determinant, then muscles are expected to scale geometrically, and muscle dimensions change proportionally with changes in organism size. With geometric scaling, body mass increase is associated with 1:1 increase in muscle mass, an increase in length proportional to (mass) 1/3 and a change in area proportional to (mass) 2/3 [12]. In contrast, positive allometry indicates that a muscle architectural properties increase proportionally greater than predicted by mass alone, while negative allometry indicates the opposite [12]. If the obligate human upright posture has a major effect on scaling relationships, we hypothesized that PFM PCSA would increase proportionally greater than predicted by body size, as these muscles have to produce a much greater force in order to counteract intra-abdominal pressure and gravity. Analogously, we hypothesized a positive allometric scaling of fiber length, as a greater excursion is necessary to facilitate childbirth of a relatively large encephalized human fetus. Architecture scaling data provide the framework for hypotheses about how these muscle functions change with body mass.
Therefore, the purpose of this study was to quantify PM architecture among three common laboratory species and compare them with the human PFM to understand to determine the extent of architectural similarity and how these muscles' architectural properties scale with body size.
Materials and methods
The University of California Institutional Animal Care Committee (IACUC) approved all procedures performed. Three laboratory species commonly used in PFD research were studied: female mouse (Mus musculus) of C57BL/6 strain (n=10), female Sprague–Dawley rat (Rattus norvegicus) (n=10), and female New Zealand white rabbit (Oryctolagus cuniculus) (n=10). The age of the animals used in this study was 3 months for mouse and rat and 8 months for rabbit, as the animals reach reproductive capability at these respective ages. All animals were nulligravid. The human architectural data used for comparison were previously reported by our laboratory [9]. Animals were sacrificed, and PM were fixed in situ attached to the skeleton in 10 % buffered formaldehyde for 3–5 days. After fixation, the C, IC, and PC were identified by tracking individual muscles along their length. The following bony landmarks were used to identify origin/insertion of each muscle: (1) rat/mouse:–C, origin pubic bone, insertion caudal (Ca) 1–2 vertebrae; IC, origin ilium, insertion Ca5–Ca6 vertebrae; PC, origin pubic bone, insertion Ca3–Ca4 vertebrae. (2) Rabbit: C, origin ischial spine, insertion sacral (Sa) 2–4, Ca1 vertebrae; IC, origin ilium, insertion Ca5 vertebra; PC, origin ilium, insertion Ca6–Ca8 vertebrae.
Muscles from either the left or the right side of each specimen were chosen at random to assess architectural parameters. Lm was measured from the origin of the most proximal fibers to the insertion of the most distal fibers in situ, after which each muscle was harvested, gently blotted dry, and weighed. Due to their small size, identification and dissection of the individual muscles in mouse was done under a microscope. Each muscle was divided into three regions (cephalad, middle, caudate for C; medial, middle, lateral for IC and PC). Three muscle-fiber bundles were dissected from random locations within each region for architectural measurements in rabbit, with a single random bundle dissected from each region in mouse and rat due to their small size. Fiber length (Lf) was measured from these bundles using electronic digital calipers to the nearest 0.01 mm. Under a dissecting microscope, fibers were microdissected and mounted on a slide for sarcomere-length (Ls) determination by laser diffraction, as previously described [8], with the primary purpose being to calculate the number of sarcomeres in fibers to normalize fiber length and account for potential differences in muscle positions during the fixation process. Even though we were not trying to define the in vivo Ls, our measurements provide information regarding individual muscle Ls, as the fixation process shortens the Ls at most by 10 % of its in vivo length. Values for sarcomere number (Sn) and normalized fiber length (Lfn) were calculated for the isolated bundles according to the following equations, which thus account for differences among specimen length at the time of fixation:
| (1) |
| (2) |
where Lf is measured fiber length, Ls is measured sarcomere length, Lfn is normalized muscle fiber length, and Lso represents optimal sarcomere length for each particular species. Optimal species-specific Ls was calculated as twice thin filament length plus half the width of the bare zone of the myosin filament [13]. Normalized muscle length (Lm) was derived similarly to normalized fiber length. PCSA, measured in cm2, was calculated according to the following equation [6]:
| (3) |
where M is mass, θ is pennation angle (correction for fiber angulation was omitted, as fiber rotation during muscle contraction permits tensile force transmission to occur even when muscle fibers are oriented at an angle relative to the muscle's force-generating axis [14]), ρ is muscle density (we used the value of 1.056 g/cm3, which is specific to fixed tissue [15]), and Lfn is normalized fiber length.
To compare the overall architectural similarity between humans and each animal species, the Architectural Difference Index (ADI) was calculated [16]. The ADI compares muscle architecture between species, with a smaller ADI indicating greater similarity for the parameters studied. Since functional considerations are of the most interest when choosing a PFM model, percent muscle mass, fiber-length to muscle-length ratio (Lf/Lm), Ls to optimal Ls ratio (Ls/Lso), and percent PCSA were chosen as the parameters to be compared based on previously determined architectural properties that best characterize the muscle and distinguish among muscles [16]. The ADI calculation equation was formerly described [16]:
| (4) |
where n is the number of discriminating parameters (4 in this case), Pi,k and Pj,k represent the kth discriminating parameter for muscles i and j, respectively, and Pmax,k, and Pmin,k are the maximum and minimum values for that parameter across the whole data set. Since the ADI for each animal was calculated with respect to humans, human ADI is 0.
Scaling equations were obtained using standard least-squares regression. Body mass was defined as the independent variable, and log-10-transformed variables for each species were used to calculate regressions. The equations are reported in the form y=aMb (where y is the architectural variable, a is the scaling coefficient, M is the animal mass, and b is the scaling exponent) [10, 11]used to interpret scaling relationships for each architectural variable.
Statistical analysis
Repeated-measures analysis of variance (ANOVA) was used to compare mean Lf, PCSA, and Ls among PM within each species, with post hoc Tukey's tests, as appropriate. Two-way ANOVA was used to compare functional PM ratios between human and each animal species, with post hoc Tukey's tests, as appropriate. Significance level (α) was set to P=0.05. Results are presented as means ± standard error of the mean (SEM), except where noted. All statistical analyses were performed using GraphPad Prism version 6.00 GraphPad Software, San Diego, CA, USA.
Results
Representative muscle specimens are demonstrated in Fig. 1. The origins and insertions of the three PM, C, IC, and PC in rabbit and rat were consistent with previously published observations [17, 18], and their anatomic locations were analogous to mouse. Table 1 summarizes architectural parameters of the PFM and comparisons between individual muscles within each species. Absolute architectural values varied among species, presumably because of animal size. The PCSA and normalized Lf presented in Table 1 were used in Fig. 2a to simultaneously demonstrate the force producing and excursion capability of each muscle. Similar to humans [9], C demonstrated the shortest normalized Lf in all animal species (Table 1). Rat PC muscle, analogous to the PC in humans, had the longest fibers and thus the largest operating range; however, the difference between IC and PC only approached statistical significance (Table 1). In rabbit and mouse, Lfn of IC and PC was also not statistically different, with IC having the longest Lfn. PCSA of rat and mouse C, similar to human muscles, did not differ from IC or PC (Table 1); however, as opposed to human IC and PC, which had the same PCSA, PCSA of rat and mouse IC significantly exceeded that of PC, allowing a greater force generation by IC. In rabbit, PCSA of IC and PC did not differ significantly; however, PCSA of C was almost four times greater than of IC and PC (Table 1). Despite some of the differences outlined above, as in humans, PCSA values of PM in all animal species, with the exception of rabbit C muscle, are small compared with other skeletal muscles, indicating they would produce relatively small forces [19]. Similar to human PFM, there were no significant differences in Ls among PM in rat and mouse. In rabbit, Ls of C was significantly shorter than Ls of IC and PC (Table 1).
Fig. 1.

Representative muscles from each species studied. Scale bar for all muscles is 10 mm. Average body mass for each species was: mouse =0.02 kg, rat =0.2 kg, rabbit =4.17 kg, human =46.27 kg
Table 1. Complete data for coccygeus (C), iliococcygeus/iliocaudalis (IC), and pubococcygeus/pubocaudalis (PC) for all species represented as means ± standard error of the mean (SEM).
| Muscle | Species (n = 10 each) | Mass (g) | Lmn (mm) | Lfn (mm) | Ls (μm) | PCSA (cm2) |
|---|---|---|---|---|---|---|
| C | Mouse | 0.01 ±0.001 | 7.33±0.28 | 4.07±0.24 | 2.41±0.11 | 0.02±0.002 |
| Rat | 0.05±0.01 | 12.79±0.58 | 7.61±0.35 | 2.30±0.06 | 0.07±0.007 | |
| Rabbit | 1.49±0.11 | 20.65±1.27 | 12.63±0.65 | 2.22±0.09 | 1.11 ±0.06 | |
| Human | 3.91±0.48 | 51.82±2.62 | 42.95±3.48 | 2.52±0.06 | 0.87±0.08 | |
| IC | Mouse | 0.02±0.001 | 12.72±0.20 | 8.09±0.41 | 2.30±0.06 | 0.02±0.002 |
| Rat | 0.12±0.01 | 22.10±0.48 | 14.77±0.24 | 2.36±0.04 | 0.08±0.004 | |
| Rabbit | 0.57±0.07 | 35.94±2.17 | 18.29±0.94 | 2.68±0.08 | 0.29±0.03 | |
| Human | 4.89±0.38 | 77.07±5.66 | 57.97±5.29 | 2.64±0.07 | 0.83±0.07 | |
| PC | Mouse | 0.01±0.001 | 10.88±0.34 | 7.026±0.20 | 2.19±0.04 | 0.01±0.002 |
| Rat | 0.11 ±0.01 | 25.14±1.06 | 16.17±0.38 | 2.25±0.04 | 0.06±0.005 | |
| Rabbit | 0.44±0.06 | 29.74±1.31 | 17.52±0.69 | 2.68±0.05 | 0.23±0.03 | |
| Human | 6.39±0.98 | 97.65±6.81 | 78.19±7.39 | 2.77±0.12 | 0.79±0.08 | |
| C vs IC* | Mouse | <0.0001 | <0.0001 | 0.0001 | 0.69 | 0.10 |
| Rat | <0.0001 | <0.0001 | <0.0001 | 0.79 | 0.08 | |
| Rabbit | <0.0001 | <0.0001 | 0.0018 | 0.0017 | <0.0001 | |
| Human | 0.025 | 0.0002 | 0.0061 | 0.53 | 0.89 | |
| C vs PC* | Mouse | 0.033 | 0.0001 | <0.0001 | 0.23 | 0.59 |
| Rat | <0.0001 | <0.0001 | <0.0001 | 0.64 | 0.68 | |
| Rabbit | <0.0001 | 0.001 | 0.001 | 0.0009 | <0.0001 | |
| Human | 0.019 | <0.0001 | 0.0002 | 0.10 | 0.71 | |
| IC vs PC* | Mouse | <0.0001 | 0.0005 | 0.17 | 0.25 | 0.009 |
| Rat | 0.18 | 0.08 | 0.07 | 0.053 | 0.02 | |
| Rabbit | 0.51 | 0.042 | 0.69 | 0.87 | 0.30 | |
| Human | 0.16 | <0.0001 | 0.0005 | 0.70 | 0.92 |
Lmn muscle length normalized to optimal sarcomere length of each species, Lfn fiber lengths normalized to optimal sarcomere length of each species, PCSA physiological cross-sectional area
P values derived from repeated measures analysis of variance (ANOVA), followed by Tukey's pairwise comparisons
Fig. 2.
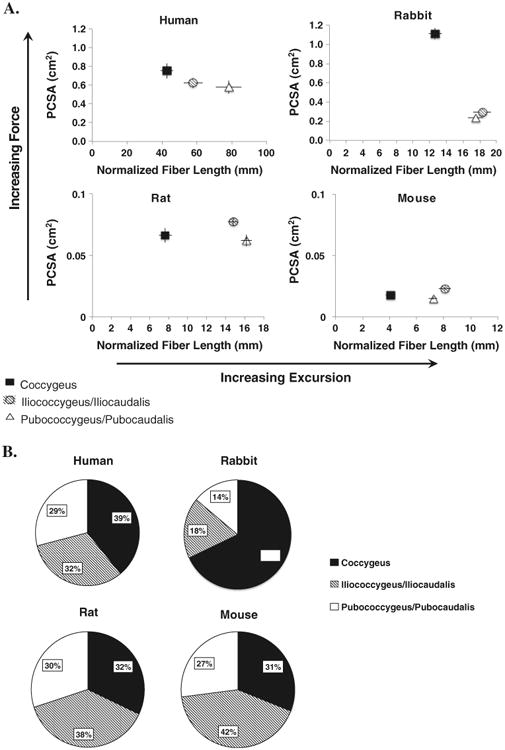
a) Normalized fiber length (Lfn) and physiological cross-sectional area (PCSA) for human, rabbit, rat, and mouse pelvic muscles represented as means ± standard error of the mean. Error bars not visible are smaller than the symbols. b) Percent contribution of each muscle to total pelvic muscle PCSA
Muscle mass varied over two orders of magnitude and muscle length over 1.5 orders among species. Given these differences in absolute values, meaningful ratios reflecting muscle function were determined for clearer comparisons (Table 2). Lf/Lm provides insights into excursion, an important active property of the muscle [20]. Ls/Lso provides information regarding the force sarcomeres generate when muscle is stimulated. We also included individual muscle mass and PCSA contribution to total PM. Ratios were compared between human and each of species (Table 2). Lf/Lm was significantly less in rat and mouse in C and PC and similar in IC compared with human. Lf/Lm of rabbit was similar to human in C but significantly less in IC and PC (Table 2). Ls/Lso in all PM was similar between human and rat. This ratio differed in C between human and rabbit and in PC between human and mouse (Table 2). Percent PCSA of each PM was closest between human and rat, with each individual muscle contributing approximately a third of the total PCSA of all PM (Fig. 2b).
Table 2. Relative mass, length, and physiological cross-sectional area (PCSA) data for coccygeus (C), iliococcygeus/Iliocaudalis (IC), and pubococcygeus/pubocaudalis (PC) for all species, represented as means ± standard error of the mean (SEM).
| Muscle | Species (n = 10 each) | Lfn/Lmn | Ls/Lso | Percent total PM PCSA | Percent total PM mass |
|---|---|---|---|---|---|
| C | Mouse | 0.56±0.03 | 1.00±0.04 | 30.68±2.72 | 19.33±2.17 |
| Rat | 0.44±0.03 | 0.96±0.03 | 31.72±1.37 | 18.44±1.05 | |
| Rabbit | 0.63±0.05 | 0.82±0.03 | 68.19±1.74 | 60.19±2.13 | |
| Human | 0.81±0.09 | 0.93±0.02 | 38.59±2.37 | 26.09±2.17 | |
| IC | Mouse | 0.64±0.03 | 0.94±0.01 | 42.11 ±2.27 | 51.44±1.82 |
| Rat | 0.68±0.02 | 0.98±0.02 | 37.97±1.35 | 42.43±1.06 | |
| Rabbit | 0.52±0.03 | 1.04±0.03 | 17.60±1.51 | 22.56±2.17 | |
| Human | 0.75±0.05 | 0.98±0.03 | 32.24±2.15 | 33.27±2.37 | |
| PC | Mouse | 0.65±0.02 | 0.92±0.02 | 27.21±1.55 | 29.24±1.42 |
| Rat | 0.65±0.03 | 0.94±0.02 | 30.31 ±1.61 | 39.13±1.24 | |
| Rabbit | 0.59±0.02 | 1.03±0.02 | 14.20±1.27 | 17.25±1.32 | |
| Human | 0.84±0.09 | 1.02±0.04 | 29.17±2.34 | 40.64±3.03 | |
| C: human vs other species* | Mouse | 0.004 | 0.24 | 0.02 | 0.07 |
| Rat | <0.0001 | 0.88 | 0.06 | 0.03 | |
| Rabbit | 0.07 | 0.02 | <0.0001 | <0.0001 | |
| IC: human vs. other species* | Mouse | 0.41 | 0.68 | 0.002 | 0.0008 |
| Rat | 0.81 | 0.99 | 0.15 | 0.006 | |
| Rabbit | 0.01 | 0.37 | <0.0001 | <0.0001 | |
| PC: human vs other species* | Mouse | 0.03 | 0.04 | 0.89 | 0.0003 |
| Rat | 0.042 | 0.1 | 0.97 | 0.94 | |
| Rabbit | 0.003 | 0.9 | <0.0001 | <0.0001 |
Lmn muscle length normalized to optimal sarcomere length of each species, Lfn fiber lengths normalized to optimal sarcomere length of each species, Ls sarcomere length, Lso, optimal sarcomere length, PCSA physiological cross-sectional area
P values derived from two-way analysis of variance (ANOVA), followed by Tukey's pairwise comparisons
The functional ratios listed in Table 2 were used to calculate ADI. When ADI for all muscles was calculated, rat was found to be nearest to humans (ADI = 2.5), followed by mouse (ADI = 3.3) (Fig. 3). Rabbit showed the greatest difference from humans, with an ADI more than double that of rat (ADI = 6.6).
Fig. 3.

Combined and individual pelvic muscle (PM) architectural difference index (ADI). A perfect architectural match is an ADI of zero [19]; thus, lower values indicate greater similarity to humans
Log-transformed data revealed that mass, Lmn, Lfn, and PCSA scaled with body mass (0.83≤r2≤0.97) (Table 3). Scaling exponents for all parameters for all three muscles were negative, demonstrating negative allometry or a smaller increase than one predicted by geometric scaling, as determined by mean and 95 % confidence intervals (CI). For muscle mass, exponents ranged from 0.68 to 0.85 (compared with an expected value of 1 for geometric scaling), Lmn exponents ranged from 0.22 to 0.25 (0.33 for geometric scaling), Lfn exponents ranged from 0.22 to 0.29 (0.33 for geometric scaling), and PCSA exponents ranged from 0.42 to 0.55 (0.66 for geometric scaling) (Table 3). When humans were removed from regression calculations, scaling relationships did not change, with the exception of C muscle mass and PCSA, which demonstrated geometric scaling with 1.01 (0.93–1.09) and 0.80 (0.71–0.89) exponents, respectively.
Table 3. Regression exponents and coefficients of the scaling equation y=aMb for muscle mass, normalized muscle length, normalized fiber length, and physiological cross-sectional area (PCSA) relative to body mass. Values are mean ± standard error of the mean (SEM).
| Geometric scaling | ||||||||
|---|---|---|---|---|---|---|---|---|
|
| ||||||||
| Muscle | b | 95 % CI of b | r2 | a | b | 95 % CI of b | r2 | a |
| Muscle mass | Normalized muscle length | |||||||
| C | 0.85±0.03 | 0.79–0.91 | 0.96 | −3.22±0.1 | 0.25±0.01 | 0.22–0.27 | 0.91 | 0.51±0.04 |
| IC | 0.68±0.02 | 0.64–0.72 | 0.97 | −2.60±0.06 | 0.22±0.01 | 0.20–0.24 | 0.93 | 0.80±0.03 |
| PC | 0.76±0.03 | 0.71–0.82 | 0.95 | −2.91 ±0.09 | 0.25±0.01 | 0.22–0.28 | 0.88 | 0.72±0.05 |
| Normalized fiber length | PCSA | |||||||
| C | 0.29±0.01 | 0.26–0.32 | 0.91 | 0.19±0.05 | 0.55±0.04 | 0.47–0.63 | 0.84 | −2.41±0.13 |
| IC | 0.22±0.02 | 0.19–0.26 | 0.85 | 0.59±0.05 | 0.42±0.02 | 0.39–0.46 | 0.95 | −2.15±0.05 |
| PC | 0.27±0.02 | 0.23–0.31 | 0.83 | 0.48±0.06 | 0.46±0.02 | 0.42–0.50 | 0.94 | −2.37±0.06 |
C coccygeus, IC iliococcygeus/Iliocaudalis, PC pubococcygeus/pubocaudalis
Discussion
The vital role of PFM in proper pelvic floor support and the deleterious impact of their injury and dysfunction, in most cases resulting from maternal birth trauma, have been well established through imaging and modeling studies [3]. Nevertheless, PFM are vastly understudied. The knowledge gap is due in part to the challenging ethical issues surrounding the procurement of human PFM tissue. This is particularly problematic in studies of muscle architecture, which require access to the entire muscle. Animal models allow for studies that are impossible in humans. Significant advances in the treatment of muscular dysfunction became possible once precise muscle structure–function relationships, physiology, and pathophysiology were established in specialties such as orthopedics and cardiology [21–23]. An analogous leap forward is essential for progress to be realized in female pelvic medicine. To clearly define normal PFM function and elucidate the impact that pregnancy, parturition, and birth injury have on these muscles, an animal model is necessary, and NHP are considered the best model for such study [24]. However, despite some similarities between human and NHP PM, studies focused on these models have not been as helpful as many investigators had hoped. In contrast to humans, PM did not change in response to pregnancy or parturition in squirrel monkeys [25], and gross disruption of these muscles in the same species did not lead to the development of pelvic organ prolapse [26]. NHP research is also severely limited due to regulatory challenges and expense. Due to the lack of data on various end points of interest in studies of PM, appropriate PM sample sizes are unknown and can potentially be large enough to make use of the NHP model even more unrealistic. Thus, we focused on the comparison of PM architecture of humans to commonly used laboratory species, as this structural parameter is an excellent predictor of muscle function.
In humans, PFM design shows differential architecture of the individual components, with PC muscles demonstrating the longest fibers and C having the largest PCSA, making it a good stabilizer [9]. It is common to assume that animals closer in size to humans represent more relevant models. However, this is not always the case. For example, comparison of rotator cuff muscle architecture among eight species ranging from mouse to cow actually suggested that the rodent rotator cuff was more similar to humans in terms of intrinsic design than that of the larger quadrupeds [27]. Likewise, in our study, through assessing the design of muscle structure, we found rabbit to have the highest ADI, i.e., to be the furthest from human, even though it was roughly on the same size scale in terms of muscle mass. Rat was the nearest to human with respect to PFM architecture, followed by mouse. Our data show that in terms of relative muscle PCSA contribution, rat and mouse architecture are nearly an exact match to that of the human (Fig. 2B). Although none of the species studied are an ideal match to human PFM, the relationship of PCSA to Lfn in rat and mouse more closely matches that of humans than does rabbit (Fig. 2a). Similar to humans, in rat, the Lfn increased from C to IC to PC; however the largest PCSA was found in IC. For all PM, Lf/Lm ratios of humans were higher than those in animal species, meaning humans have the greatest potential for PFM excursion (Table 2). Human PFM are involved in parturition; thus, a muscle design shifted toward greater excursion, especially in PC, is advantageous given encephalization and large fetal size in the human species. However, when we examined the scaling relationship of PM architecture, in contrast to our hypothesis, we found a negative allometric relationship with respect to body mass for all three muscles of all parameters examined (Table 3). Thus, changes in PM architectural parameters do not follow the assumptions that one would make based on the upright posture and large fetal size in humans. One possible reason is loss of the tail-wagging function of the PC and IC muscles in humans. Another potential explanation lies in the complex function of PFM, which simultaneously need to provide support to the viscera; constrict the urethra, vagina, and anal canal; and at the same time allow movement of contents from one cavity to another (urination, defecation, parturition) and is consistent with our previous finding that PFM generate forces much smaller than other human skeletal muscles [9]. Adding or removing humans from the analysis did not significantly change the results, with the exception of muscle mass and PCSA in the C. This is not surprising given a vastly different C muscle with respect to these parameters in rabbit (Fig. 2a and b). Establishing scaling relationship in PM has important implications in modeling, especially because architectural properties cannot be estimated based on body mass alone.
An obvious limitation of this report is the small number of species studied. Our goal was to specifically compare and contrast common laboratory animals rather than determine phylogenetic relationships of PFM across the animal kingdom. An obvious future goal would be to add additional species, especially those with a greater body mass, which will likely provide an even greater understanding of muscle scaling among species. Also, results of this study are only valid for these three species and for loading characteristics their PM experience. We recognize that the difference in posture and small fetal size of the species we evaluated makes naturally occurring PFD a rare event in these animals. However, a rodent model has been a reliable exemplar for the study of pregnancy adaptations and effects of simulated birth injury [28, 29]. Pregnancy-induced adaptations in rat persist postpartum [29]; also, simulated birth injury in rodent induces stress urinary incontinence via injury of striated muscles [30]. Despite the limitations listed above, our study provides prerequisite data on the structure of the pelvic skeletal muscle in mouse, rat, and rabbit, all of which are frequently used for studying PFD. We established that similarity in major architectural parameters, the main determinants of skeletal muscle function, between rodents and human PM exists. We anticipate that the use of rat or mouse models will significantly aid in revealing the impact of pregnancy, parturition, and untreated and treated birth injury on human PFM.
Acknowledgments
Funding: The authors gratefully acknowledge funding by NIH grants K12 HD001259 and R24 HD050837.
Footnotes
Conflicts of interest: None.
Contributor Information
Marianna Alperin, Department of Reproductive Medicine, Division of Female Pelvic Medicine and Reconstructive Surgery, University of California San Diego, San Diego, CA, USA.
Lori J. Tuttle, Doctor of Physical Therapy Program Exercise and Nutritional Sciences, San Diego State University, San Diego, CA, USA
Blair R. Conner, Department of Orthopaedic Surgery, University of California San Diego, San Diego, CA, USA
Danielle M. Dixon, Department of Bioengineering, University of California San Diego, San Diego, CA, USA
Margie A. Mathewson, Department of Bioengineering, University of California San Diego, San Diego, CA, USA
Samuel R. Ward, Department of Orthopaedic Surgery, University of California San Diego, San Diego, CA, USA; Department of Bioengineering, University of California San Diego, San Diego, CA, USA; Department of Radiology, University of California San Diego, San Diego, CA, USA
Richard L. Lieber, Email: rlieber@ucsd.edu, Department of Orthopaedic Surgery, University of California San Diego, San Diego, CA, USA; Department of Bioengineering, University of California San Diego, San Diego, CA, USA; Department of Radiology, University of California San Diego, San Diego, CA, USA; Department of Veterans Affairs Medical Center San Diego, San Diego, CA, USA; University of California and V.A. Medical Centers, 9500 Gilman Drive La Jolla, San Diego, CA 92093-0863, USA.
References
- 1.Subak LL, et al. Cost of pelvic organ prolapse surgery in the United States. Obstet Gynecol. 2001;98(4) doi: 10.1016/s0029-7844(01)01472-7. [DOI] [PubMed] [Google Scholar]
- 2.Kearney R, et al. Levator ani injury in primiparous women with forceps delivery for fetal distress, forceps for second stage arrest, and spontaneous delivery. International journal of gynaecology and obstetrics: the official organ of the International Federation of Gynaecology and Obstetrics. 2010;111(1):19–22. doi: 10.1016/j.ijgo.2010.05.019. [DOI] [PMC free article] [PubMed] [Google Scholar]
- 3.DeLancey JOL, et al. Comparison of levator ani muscle defects and function in women with and without pelvic organ prolapse. Obstet Gynecol. 2007;109(2, Part 1):295–302. doi: 10.1097/01.AOG.0000250901.57095.ba. doi:10.1097/01.AOG. 0000250901.57095.ba. [DOI] [PubMed] [Google Scholar]
- 4.Otto LN, et al. The rhesus macaque as an animal model for pelvic organ prolapse. Am J Obstet Gynecol. 2002;186(3):416–421. doi: 10.1067/mob.2002.121723. [DOI] [PubMed] [Google Scholar]
- 5.Lieber RL, Fridén J. Functional and clinical significance of skeletal muscle architecture. Muscle Nerve. 2000;23(11):1647–1666. doi: 10.1002/1097-4598(200011)23:11<1647::aid-mus1>3.0.co;2-m. [DOI] [PubMed] [Google Scholar]
- 6.Powell PL, et al. Predictability of skeletal muscle tension from architectural determinations in guinea pig hindlimbs. J Appl Physiol Respir Environ Exerc Physiol. 1984;57(6):1715–1721. doi: 10.1152/jappl.1984.57.6.1715. [DOI] [PubMed] [Google Scholar]
- 7.Winters TM, et al. Whole muscle length-tension relationships are accurately modeled as scaled sarcomeres in rabbit hindlimb muscles. J Biomech. 2011;44(1):109–115. doi: 10.1016/j.jbiomech.2010.08.033. [DOI] [PMC free article] [PubMed] [Google Scholar]
- 8.Lieber RL, Yeh Y, Baskin RJ. Sarcomere length determination using laser diffraction. Effect of beam and fiber diameter Biophysical Journal. 1984;45(5):1007–1016. doi: 10.1016/S0006-3495(84)84246-0. [DOI] [PMC free article] [PubMed] [Google Scholar]
- 9.Tuttle LJ, et al. Architectural design of the pelvic floor is consistent with muscle functional subspecialization. Int Urogynecol J. 2013 doi: 10.1007/s00192-013-2189-5. [DOI] [PMC free article] [PubMed] [Google Scholar]
- 10.Gould SJ. Allometry and size in ontogeny and phylogeny. Biol Rev Camb Philos Soc. 1966;41(4):587–640. doi: 10.1111/j.1469-185x.1966.tb01624.x. [DOI] [PubMed] [Google Scholar]
- 11.Schmidt-Nielsen K. Scaling in biology: the consequences of size. J Exp Biol. 1975;194:287–307. doi: 10.1002/jez.1401940120. [DOI] [PubMed] [Google Scholar]
- 12.Alexander RM, Jayes AS, Maloiy GMO, Wathuta EM. Allometry of the large muscles of mammals. J Zool. 1981;194:539–552. [Google Scholar]
- 13.Burkholder TJ, Lieber RL. Sarcomere length operating range of vertebrate muscles during movement. J Exp Biol. 2001;204(Pt 9):1529–1536. doi: 10.1242/jeb.204.9.1529. [DOI] [PubMed] [Google Scholar]
- 14.Kawakami Y, Ichinose Y, Fukunaga T. Architectural and functional features of human triceps surae muscles during contraction. J Appl Physiol. 1998;85(2):398–404. doi: 10.1152/jappl.1998.85.2.398. [DOI] [PubMed] [Google Scholar]
- 15.Ward SR, Lieber RL. Density and hydration of fresh and fixed human skeletal muscle. J Biomech. 2005;38(11):2317–2320. doi: 10.1016/j.jbiomech.2004.10.001. [DOI] [PubMed] [Google Scholar]
- 16.Lieber RL, Brown CC. Quantitative method for comparison of skeletal muscle architectural properties. J Biomech. 1992;25(5):557–560. doi: 10.1016/0021-9290(92)90096-j. [DOI] [PubMed] [Google Scholar]
- 17.Bremer RE, et al. Innervation of the levator ani and coccygeus muscles of the female rat. Anat Rec A: Discov Mol Cell Evol Biol. 2003;275(1):1031–1041. doi: 10.1002/ar.a.10116. [DOI] [PubMed] [Google Scholar]
- 18.Martinez-Gomez M, et al. Striated muscles and scent glands associated with the vaginal tract of the rabbit. Anat Rec. 1997;247(4):486–495. doi: 10.1002/(SICI)1097-0185(199704)247:4<486::AID-AR7>3.0.CO;2-P. [DOI] [PubMed] [Google Scholar]
- 19.Brown SH, et al. Architectural and morphological assessment of rat abdominal wall muscles: comparison for use as a human model. J Anat. 2010;217(3):196–202. doi: 10.1111/j.1469-7580.2010.01271.x. [DOI] [PMC free article] [PubMed] [Google Scholar]
- 20.Zajac FE. Muscle and tendon: properties, models, scaling, and application to biomechanics and motor control. Crit Rev Biomed Eng. 1989;17(4):359–411. [PubMed] [Google Scholar]
- 21.Lieber RL. Skeletal muscle architecture: implications for muscle function and surgical tendon transfer. J of hand therapy : official journal of the American Society of Hand Therapists. 1993;6(2):105–113. [PubMed] [Google Scholar]
- 22.Lieber RL. Biology and mechanics of skeletal muscle: what hand surgeons need to know when tensioning a tendon transfer. The J of Hand Surgery. 2008;33(9):1655–1656. doi: 10.1016/j.jhsa.2008.08.010. [DOI] [PubMed] [Google Scholar]
- 23.Feinberg AW, et al. Controlling the contractile strength of engineered cardiac muscle by hierarchal tissue architecture. Biomaterials. 2012;33(23):5732–5741. doi: 10.1016/j.biomaterials.2012.04.043. [DOI] [PMC free article] [PubMed] [Google Scholar]
- 24.Couri BM, et al. Animal models of female pelvic organ prolapse: lessons learned. Expert Rev Obstet Gynecol. 2012;7(3):249–260. doi: 10.1586/eog.12.24. [DOI] [PMC free article] [PubMed] [Google Scholar]
- 25.Bracken JN, et al. Alterations in pelvic floor muscles and pelvic organ support by pregnancy and vaginal delivery in squirrel monkeys. Int Urogynecol J. 2011;22(9):1109–1116. doi: 10.1007/s00192-011-1443-y. [DOI] [PMC free article] [PubMed] [Google Scholar]
- 26.Pierce LM, et al. Levator ani muscle and connective tissue changes associated with pelvic organ prolapse, parity, and aging in the squirrel monkey: a histologic study. Am J Obstet Gynecol. 2007;197(1):60.e1–60.e9. doi: 10.1016/j.ajog.2007.02.037. [DOI] [PubMed] [Google Scholar]
- 27.Mathewson MA, et al. Comparison of rotator cuff muscle architecture among humans and selected vertebrate species. J Exp Biol. 2013 doi: 10.1242/jeb.083923. [DOI] [PMC free article] [PubMed] [Google Scholar]
- 28.Alperin M, et al. Collagen scaffold: a treatment for simulated maternal birth injury in the rat model. Am J Obstet Gynecol. 2010;202(6):589.e1–589.e8. doi: 10.1016/j.ajog.2010.04.003. [DOI] [PMC free article] [PubMed] [Google Scholar]
- 29.Alperin M, et al. Pregnancy- and delivery-induced biomechanical changes in rat vagina persist postpartum. Int Urogynecol J. 2010;21(9):1169–1174. doi: 10.1007/s00192-010-1149-6. [DOI] [PMC free article] [PubMed] [Google Scholar]
- 30.Lin AS, et al. Effect of simulated birth trauma on the urinary continence mechanism in the rat. Urology. 1998;52(1):143–151. doi: 10.1016/s0090-4295(98)00136-8. [DOI] [PubMed] [Google Scholar]