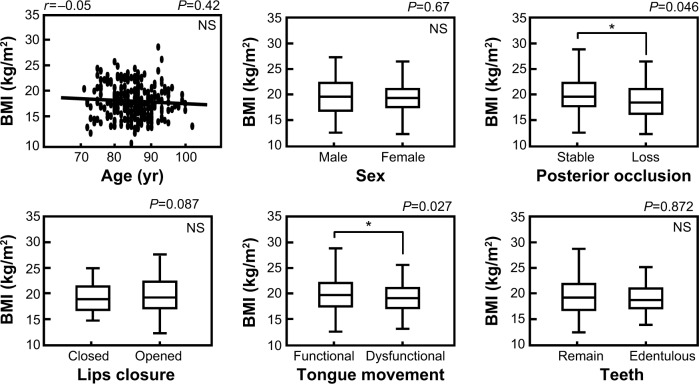
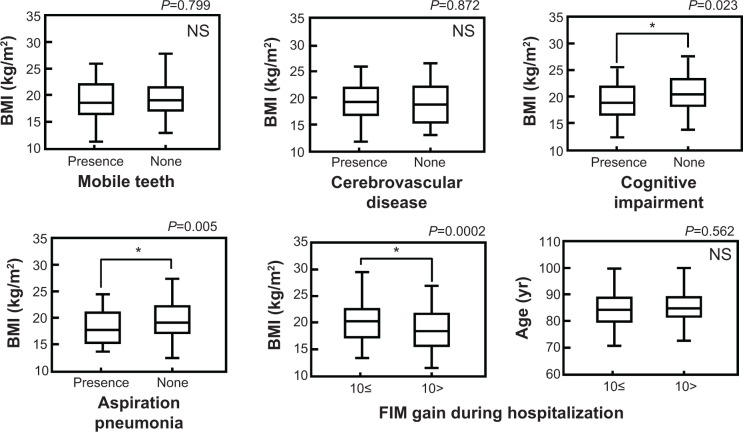
Figure 2.
Association between BMI values and other factors.
Notes: Data were described by the mean ± standard deviation (SD). FIM gain >10 points: N=133 (male/female: 48/85); FIM gain <10 points: N=129 (male/female: 53/76). The Mann–Whitney U-test was used for statistical analysis and *P-values of <0.05 were considered statistically significant.
Abbreviations: FIM, Functional Independence Measure; NS, not significant; BMI, body mass index; yr, years.


