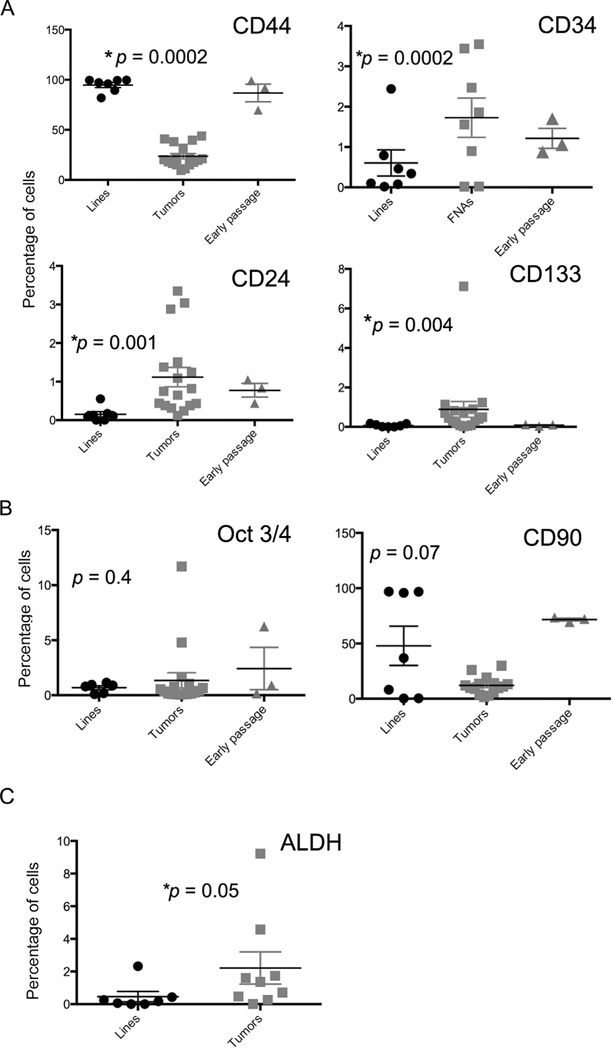
Fig. 4. gfmlmgnlmgln.
Analysis of CSC marker expression by OSA cells from cell lines versus FNA biopsy samples. (A) Comparison of percentage of surface marker staining of OSA cell lines (“lines”, passaged >20 times) and fresh OSA tumor biopsy samples (“FNAs”), and “Early passage”, consisting of cell lines in passage numbers 8, 7, and 10. p-Values are shown above each graph and reflect the comparison of cell lines and the FNAs. (B) Comparison of percentage of Oct3/4 staining (left) and CD90 staining (right). n = 7 cell line samples, 8 FNA samples, and 3 Early passage samples forOct3/4 and n = 7 cell line samples, 3 FNA samples, and 3 Early passage samples for CD90. (C) ALDH staining of OSA cell lines (n = 7) and FNA samples (n = 5). *p-Value less than 0.05 was considered significant.

