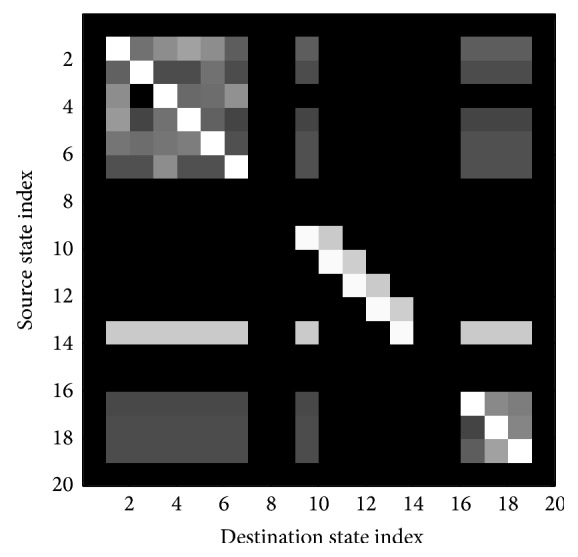
Figure 4.

Image of the transition map of the composite HMM. The matrix has a block structure with each block corresponding to one of the sound classes, background, cough, silence. The intensity of each pixel in this image corresponds to the log-probability p ij for a token to pass from the row to the column. The off-diagonal blocks correspond to transitions between the various sound classes.
