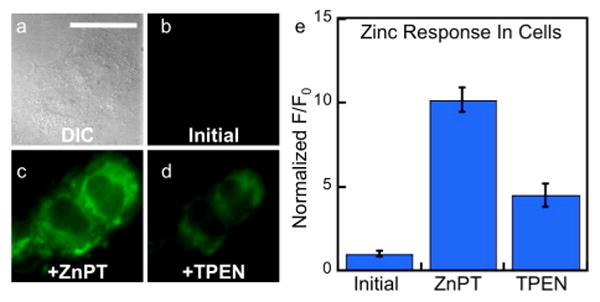
Fig. 8.

Response of DA-ZP1-r(Fxr)3 to zinc pyrithione in live HeLa cells. (a) Differential contrast image (DIC). Signal from ZP1-R9 (b) initially, (c) after addition 25 μM ZnPT, and (d) after addition of 50 μM TPEN. (e) Quantification of the fluorescence response in live HeLa cells normalized to initial level (n = 9). Scale bar = 25 μm
