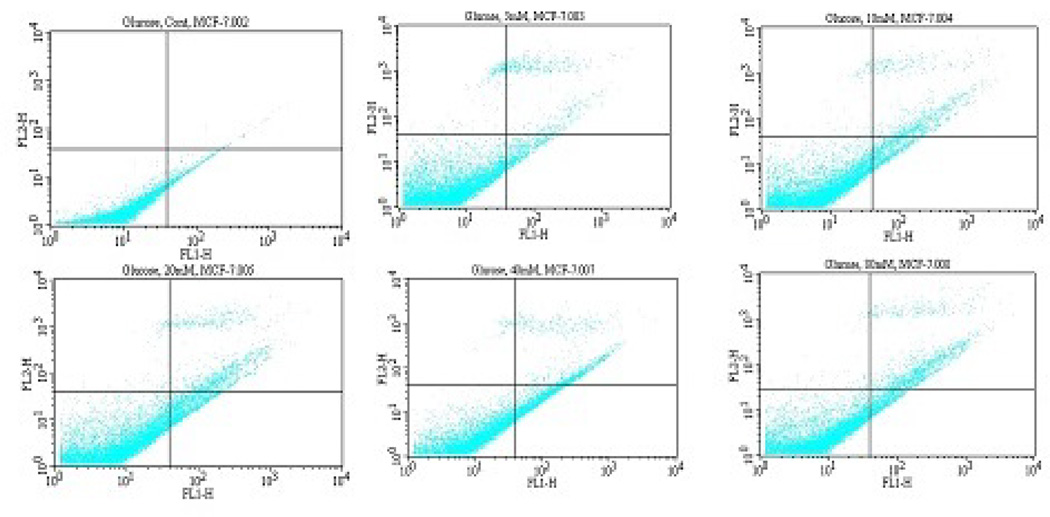
Figure 3.
Representative dot plots showing the inhibitory effect of D-glucose to MCF-7 cells upon 2 h of exposure. A = Control Cell (Untreated), B = 5 mg/ mL D-glucose, C = 10 mg/mL D-glucose, D = 20 mg/mL D-glucose, E = 40 mg/mL D-glucose, F = 40 mg/mL D-glucose. 1 = Live cells (Annexin V−/PI−), 2 = Early apoptotic cells (Annexin V+/PI−), 3 = Late apoptotic or necrotic cells (Annexin V+/PI+), 4 = Necrotic cells (PI+).

