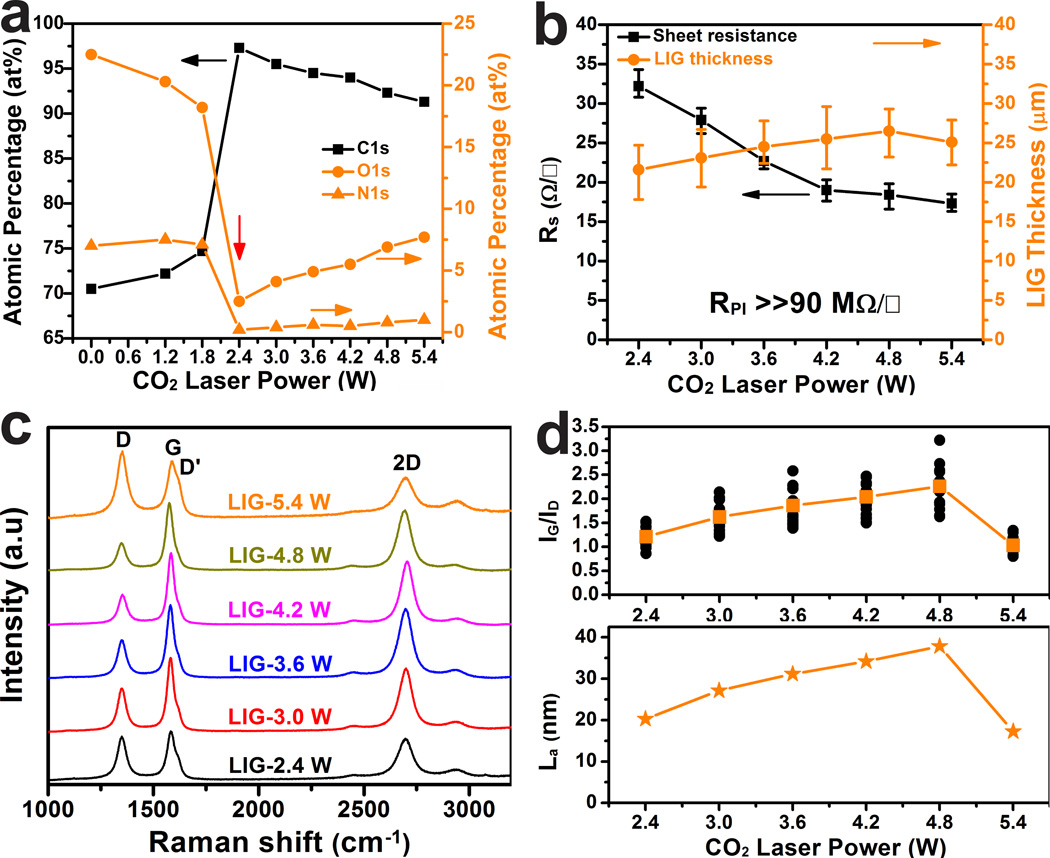
Figure 3. Characterizations of LIG prepared with different laser powers.
a, Atomic percentages of carbon, oxygen and nitrogen as a function of laser power. These values are obtained from high-resolution XPS. The threshold power is 2.4 W, at which conversion from PI to LIG occurs. b, Correlations of the sheet resistance and LIG film thicknesses with laser powers. c, Raman spectra of LIG films obtained with different laser powers. d, Statistical analysis of ratios of G and D peak intensities (upper panel), and average domain size along a-axis (La) as a function of laser power (x axis) calculated using eq 4.

