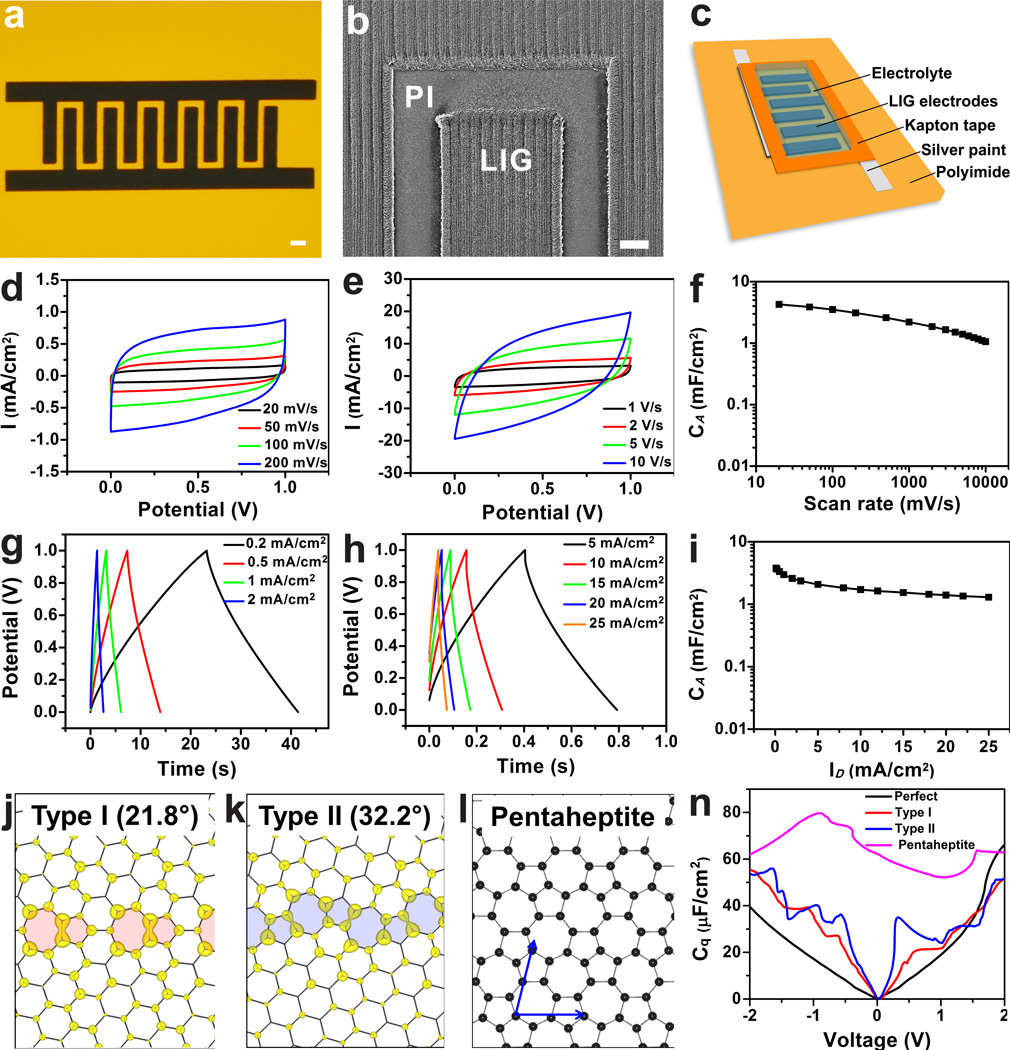
Figure 4. Electrochemical performances of LIG-MSC devices from LIG-4.8 W in 1 M H2SO4 with their GB-induced properties.
a, A digital photograph of LIG-MSCs with 12 interdigital electrodes; scale bar, 1 mm. b, SEM image of LIG electrodes; scale bar, 200 µm. c, Schematic diagram of LIG-MSCs device architecture. d and e, CV curves of LIG-MSCs at scan rates from 20 to 10,000 mV·s−1. f, Specific areal capacitance (CA) calculated from CV curves as a function of scan rates. g and h, CC curves of LIG-MSCs at discharge current densities (ID) varied from 0.2 to 25 mA·cm−2. I, CA calculated from CC curves vs. ID. j and k, Charge density distribution of the states within a voltage window (−0.1, 0.1) V for type I and II polycrystalline sheets. The defects at the grain boundaries are shadowed, and numbers show the misorientation angle between the grains. l, A carbon layer fully composed of pentagons and heptagons (pentaheptite). n, Calculated quantum capacitance (defined in the text) of perfect and polycrystalline/disordered graphene layers.

