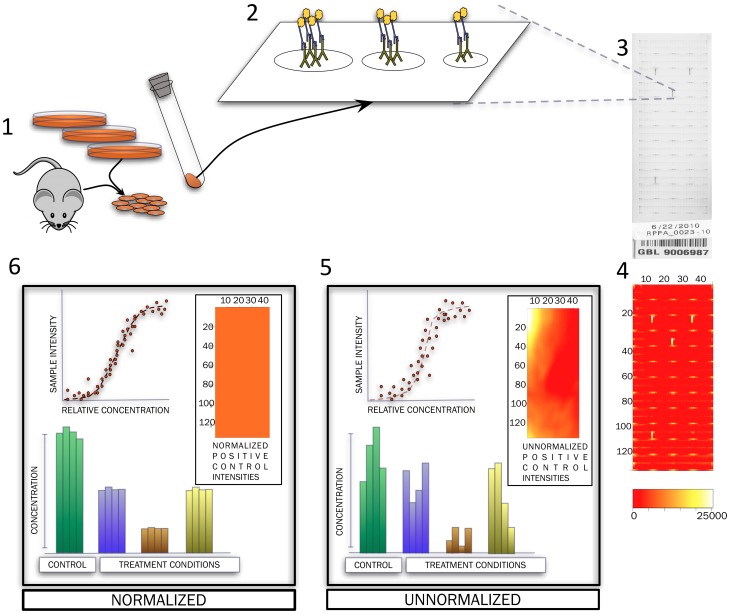
Figure 1. Steps in the acquisition and processing of RPPA data.
Cells derived from different in vitro and in vivo systems are lysed and protein extracted (1). Serially diluted extracts are printed onto the surface of slides (2) where primary and secondary antibodies bind to the protein of interest and generate a signal proportionate to the amount of protein in each sample. Each slide can accommodate 5808 printed spots, for different numbers of total samples depending on the layout and number of dilutions used (3). Readouts obtained are translated to sample intensities after scanning and processing of the slides (4). Intensities of positive control spots (horizontal yellow spots in (4)), which are technical replicates of each other, may be used to evaluate and correct spatial variation observed in each slide. Spatial correction of data can improve data quality resulting in better estimates of relative protein concentration and improved agreement between inter- and intra-slide replicates from various experiments.

