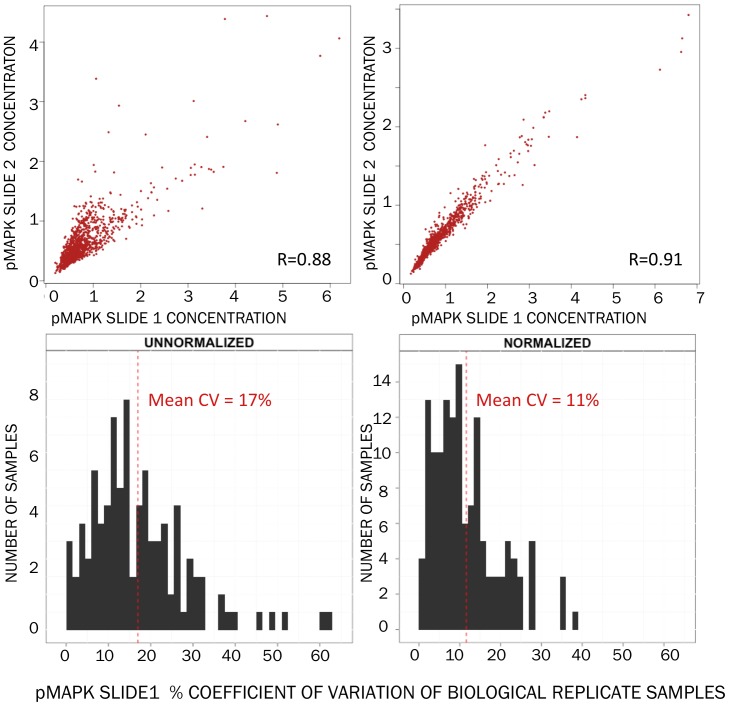
Figure 5. Correlation between concentrations of samples printed across duplicate slides increases slightly with normalization (upper panels, L→R, melanoma samples and probed with anti-pMAPK antibody).
Coefficient of variation between the concentrations of biological replicates printed on one of these slides improves after normalization (lower panels, L→R).

