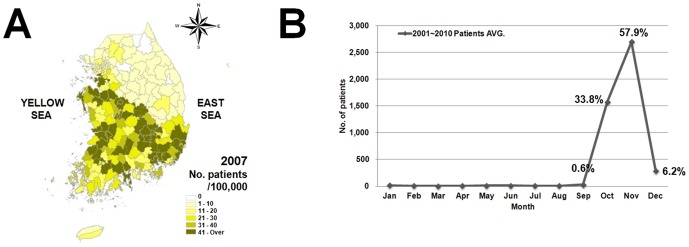
Figure 2. Scrub typhus incidence in 2007 (A), and average monthly number of patients with scrub typhus (B) from 2001 to 2010.

The figure is generated using data from the National Notifiable Disease Web Statistics System (NNDWSS) of the KCDC. Percentage (%) indicates monthly incidence rate.
