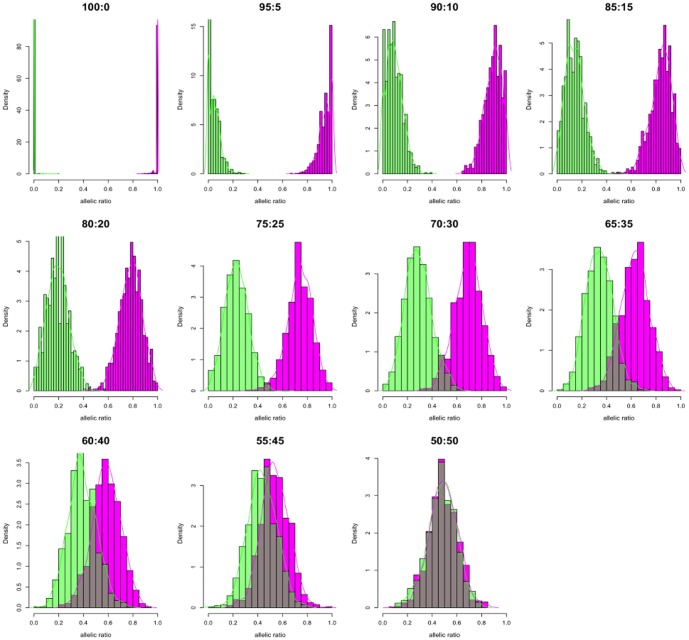
Figure 2. Phasing and distribution of in silico allelic ratios.
Histograms of showing the allelic ratio distribution after each heterozygous SNP in the in silico data is assigned phase. Each heterozygous SNP allele was covered with at least 20 reads. Alt-M allelic ratios [magenta] and Alt-P allelic ratios [green] in bins of 20. Dark bars indicate SNP ratios that overlap between phased groups. Colored lines are the kernel density estimates of the phased allelic ratio distributions.

