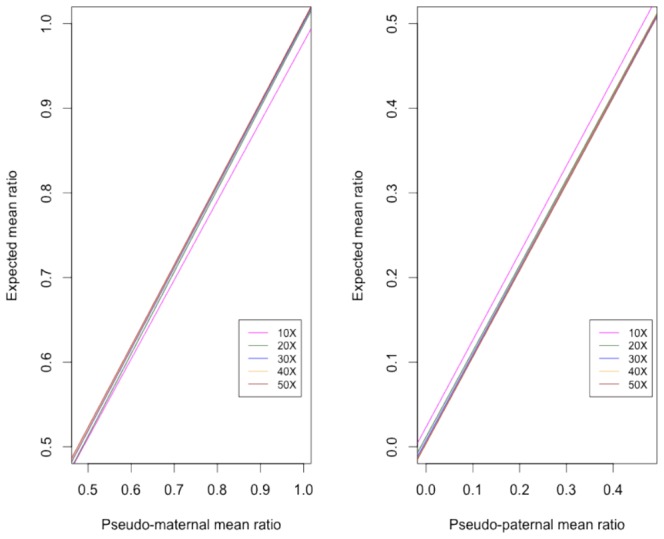
Figure 3. Correlation of expected and observed XCI ratios in terms of sequence coverage.

(A) The mean allelic ratio of the Alt-M alleles the in silico data to their corresponding expected allelic ratio. Eg. in 70∶30 simulation, Alt maternal alleles have an observed mean allelic ratio of 69.0. (B) The mean allelic ratio of Alt-P alleles from each in silico dataset. Eg. in 70∶30 simulation, Alt-P alleles have an observed allelic ratio of 27.6. Each color indicates the correlation of observed vs. expected ratios at minimum sequence coverage of 10X, 20X, 30X, 40X, and 50X. Pearson correlation coefficient was highest at r>0.9998 above 20X read coverage.
