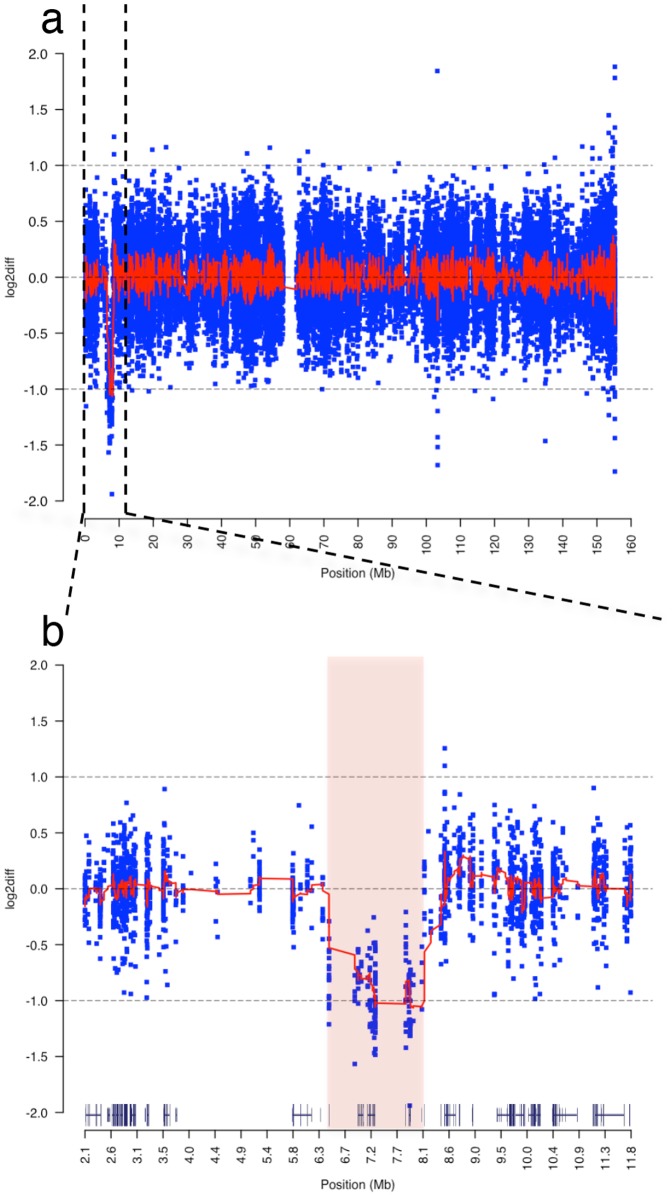
Figure 4. Characterization of de novo, interstitial, heterozygous deletion on Xp22.31.
(a) Chromosomal view of log2 coverage difference between affected child and mother obtained by WES. The log2 difference of normalized read coverage between affected child and mother is shown on the y axis, with each blue dot indicating log2 difference in normalized sequence coverage in a 100 bp window. The red line across the chromosome is the mean log2 differences across a sliding window of 25. A large deletion on chromosome X is recognizable in the child indicated by drop in log2 difference to −1 between 0–10Mbase. (b) Zoomed in view of reduced sequence read coverage between 6.4–8.1Mbase of the short arm of the chromosome. The pink shaded area indicates the deletion breakpoints predicted by aCGH analysis that overlaps with deletion seen by the exome coverage analysis. Gene tracks above the x-axis were obtained from UCSC Genome Browser and contain the deleted genes VCX3A, HDHD1, STS, VCX, PNPLA4 genes and MI4767 microRNA genes.

