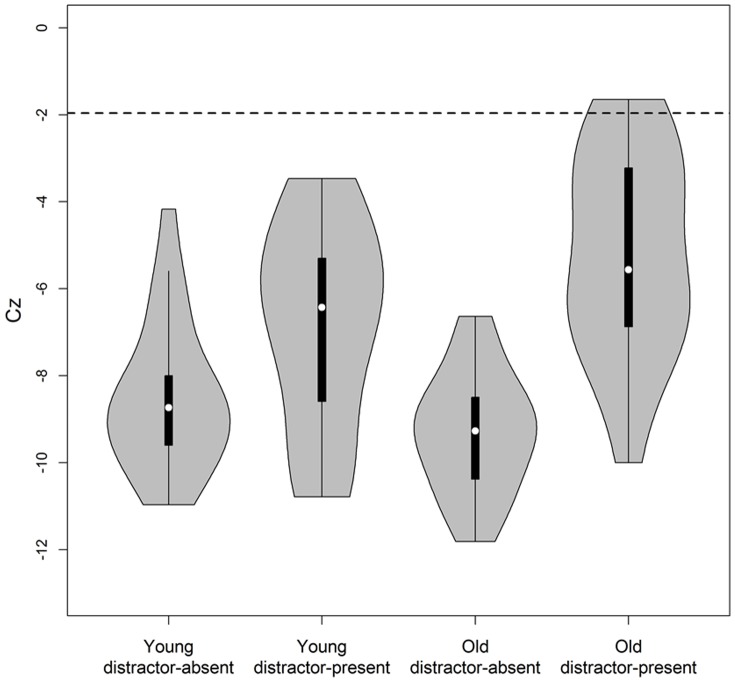
Figure 3. The distribution of Houpt and Townsend's [39] capacity test statistics, Cz, for younger and older adults across the two tasks (distractor-present and distractor-absent).
Distributions are plotted using violin plots. These plots consist of a box plot in the center of each violin, with a white circle representing the median, a black rectangle outlining the central 50% of the distribution, and a solid line extending to two standard deviations from the median. The grey area of the violin is a smoothed plot of the distribution of Cz values using a kernel density estimator. The dotted line represents the cut-off for statistically significant limited capacity.

