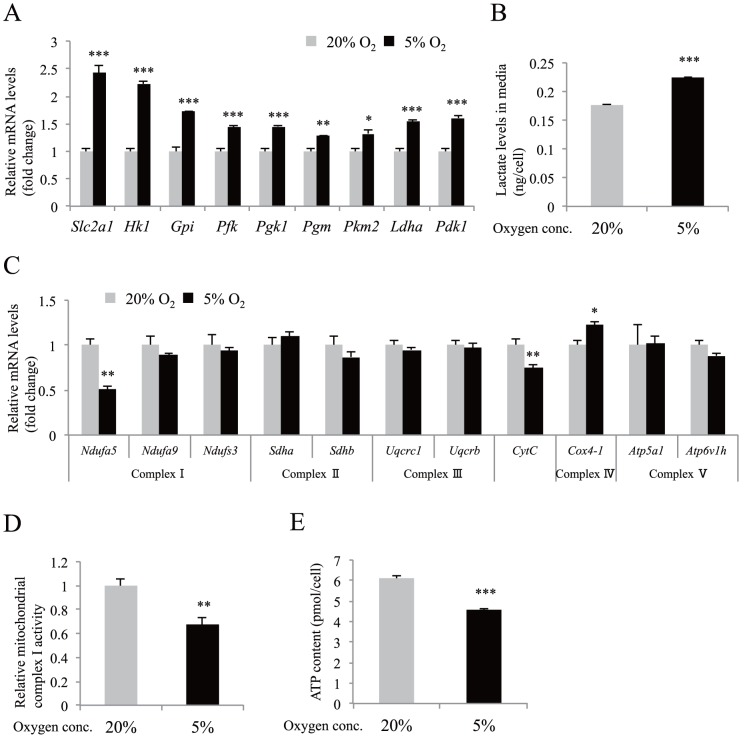
Figure 1. The effect of moderate hypoxia in MIN6 cells.
(A) Gene expression analysis by qPCR of known HIF-1 target genes was performed using hypoxic MIN6 cells (n = 4). (B) Lactate concentration in media was measured after MIN6 cells were cultured in hypoxia (n = 4). (C) Gene expression analysis by qPCR of genes encoding mitochondrial respiratory chain complex components (n = 4). (D) Mitochondrial respiratory chain complex I activity under hypoxia was assessed (n = 7). (E) Cellular ATP content under hypoxic conditions was evaluated (n = 4). In all experiments, MIN6 cells were cultured in normoxia (20% O2, gray bars) or in moderate hypoxia (5% O2, black bars) for 30 h. Each value of mRNA was normalized to that of TATA-binding protein (Tbp). The means ± S.E. (error bars) of values from each group are shown. *, p<0.05; **, p<0.01; ***, p<0.001. Lactate levels and cellular ATP content were standardized by cell number.

