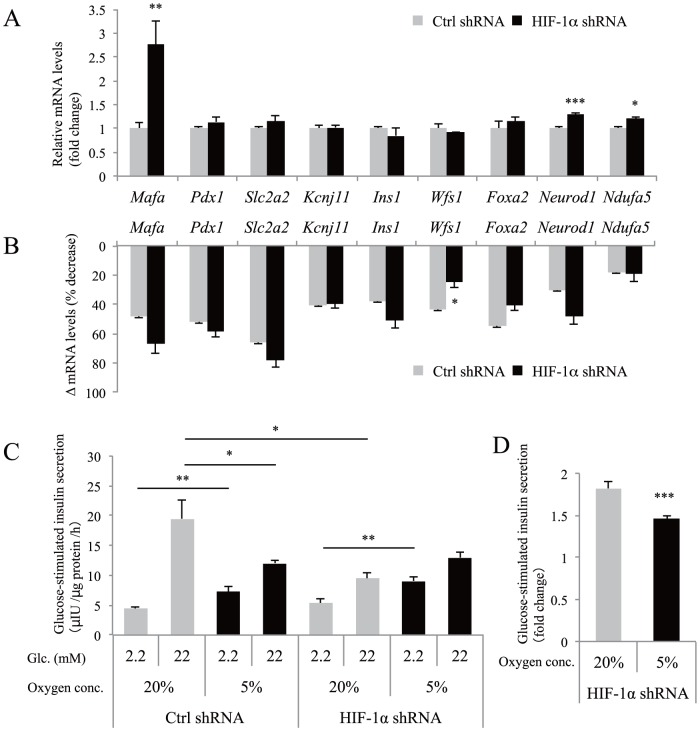
Figure 4. The role of HIF-1 in hypoxia-induced gene downregulation and insulin secretion defects in MIN6 cells.
(A) Control (Ctrl) MIN6 cells (gray bars) and HIF-1α knockdown MIN6 cells (black bars) were cultured in normoxia (20% O2) and the relative expression levels of β-cell genes were evaluated by qPCR analysis. Each value of mRNA was normalized to that of Actb. (B) Downregulation of mRNA levels (Δ mRNA levels) by 5% O2. Δ mRNA levels indicate (1-expression levels at 5% O2/expression levels at 20% O2) ×100 (%). (C) Ctrl MIN6 cells (n = 11) and HIF-1α knockdown MIN6 cells (n = 9) that had been cultured in normoxic (20% O2, gray bars) or hypoxic (5% O2, black bars) conditions for 40 h were stimulated with 2.2 mM glucose or 22 mM glucose for 1 h. Secreted insulin was normalized to cellular protein levels. (D) The fold change in glucose-stimulated insulin secretion (insulin level at 22 mM glucose divided by that at 2.2 mM glucose) is indicated (n = 9). Data are shown as the means ± S.E. (error bars) of the values from each group. *, p<0.05; **, p<0.01; ***, p<0.001.

