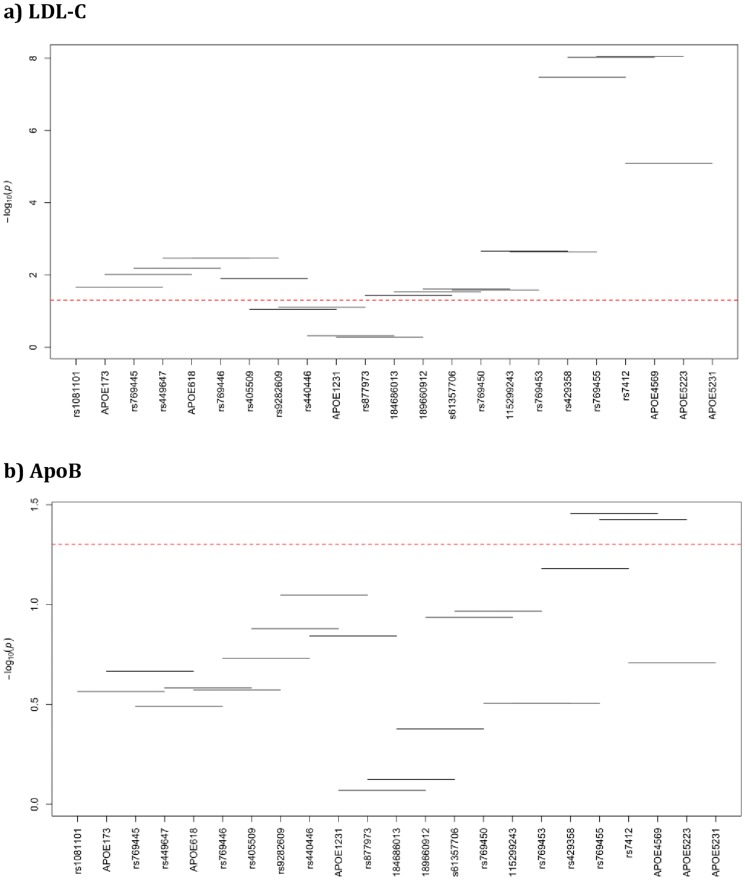
Figure 4. Haplotype analysis with lipid traits in African Blacks.
Haplotype windows for LDL-C (a), for ApoB (b), for HDL-C (c), and for TG (d). X-axis has the genotyped markers name and the Y-axis has the –log (global p-value), horizontal lines represent the 4-SNP windows, red-line represents the p-value threshold (p = 0.05) and everything below the threshold is considered non-significant and vice versa.

