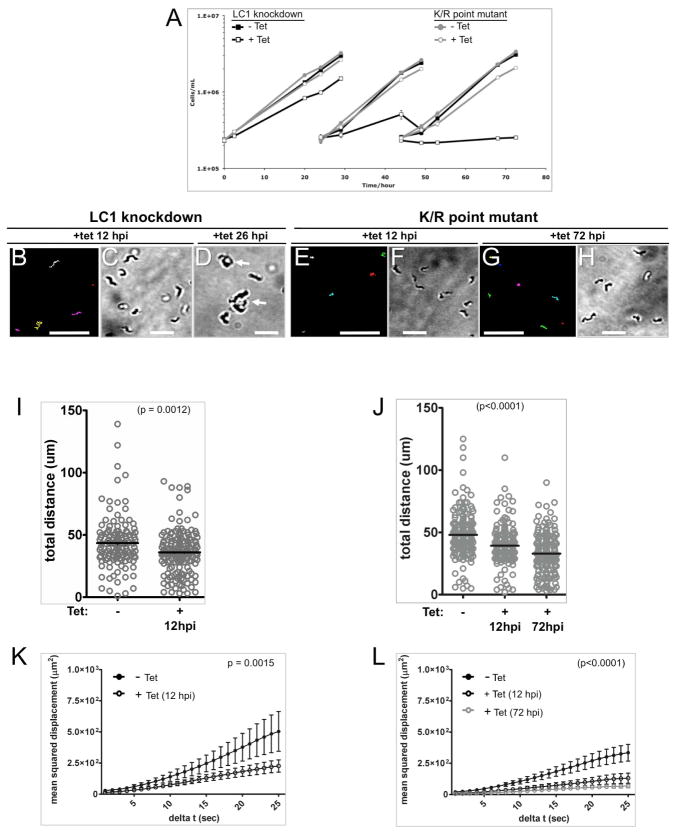
Figure 1. LC1 knockdown and LC1 K/R point mutant parasites show similar motility defects but the knockdown is lethal, while the point mutant is viable.
(A) Growth rates of LC1-knockdown cells (black lines) and K/R point mutants (gray lines). At time zero cultures were incubated with (open symbols) or without (closed symbols) tetracycline and diluted back to the starting density at 24 h and 48 h. (B, E and G) Motility traces of LC1 knockdown and LC1 K/R point mutant parasites grown with Tet for the indicated hours post-induction (hpi). Each line traces the path of a single cell for 30 seconds. (C, D, F, and H) DIC images of cultures grown with tetracycline for the indicated hpi. Arrows in panel D show cells accumulating as amorphous masses, indicating cell division failure by 26hpi for the LC1 knockdown. Scale bar is 95 um (panels B, E and G) or 25 μm (panels C, D, F and H). (I and J) Quantification of distance traveled in 30 seconds by individual LC1 knockdown (I) and K/R point mutant (J) cells grown in the absence (−) or presence (+) of Tet for the indicated times. For the LC1 knockdown, n=126 for −Tet and 159 for +Tet. For the K/R point mutant, n=180 for −Tet, 167 for +Tet(12hpi) and 190 for +Tet(72hpi). Horizontal lines indicate the mean of each data set, with bars showing the 95% confidence interval. (K and L) Mean squared displacement plotted as a function of time interval for LC1 knockdown (K) and K/R point mutant (L) trypanosomes grown without (closed circles) or with (open circles) Tet for the indicated time. n=52 for all samples and error bars show standard error of the mean.

