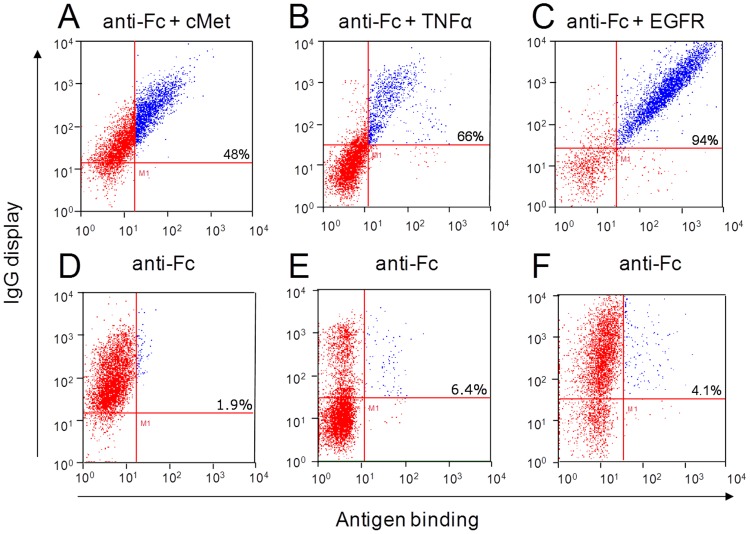
Figure 3. REAL-Select functionalized yeast cell phenotype of three different mAbs analyzed by flow cytometry.
(A) anti-cMet-B10, (B) adalimumab (C) matuzumab and the respective controls without (D) cMet, (E) TNFα, (F) EGFR. Display of functional antibodies was detected using the respective fluorescence-labeled antigen ( Table 1 ) and an Fc-specific detection antibody (IgG display). The percentage indicated in the upper right gate represents the percentage of cells in that gate, normalized to the total number of antibody displaying cells (sum of the cells in the upper left and right gate).

