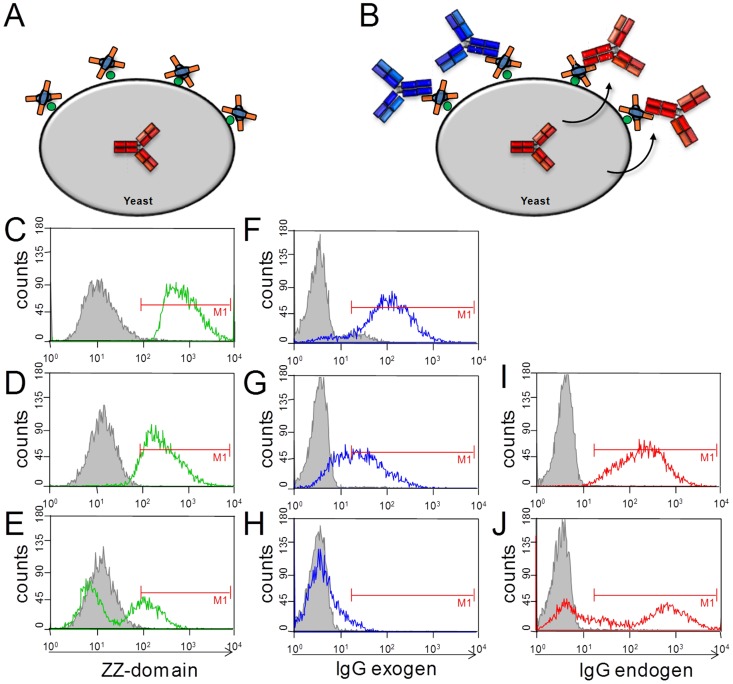
Figure 4. Flow cytometric analysis of capture domain saturation of REAL-Select functionalized yeast cells.
(A) SA-ZZ decorated cells carrying matuzumab heavy and light chain plasmids, (B) surface capture of matuzumab (red antibody) or externally added golimumab (blue antibody). (C–E) Analysis of yeast cells decorated with SA-ZZ fusion protein with goat-anti-protein A-FITC 0, 6 hours and 20 hours after surface decoration and induction of matuzumab expression. (F–H) Detection of unoccupied Fc-capture domains by incubation of cells with golimumab followed by labeling with TNFα-Dylight650 at indicated time points. (I,J) Monitoring of surface display of re-captured matuzumab by labeling cells with goat-anti-Fc F(ab′)2-AlexaFluor647 at 6 hours and 20 hours of expression.

