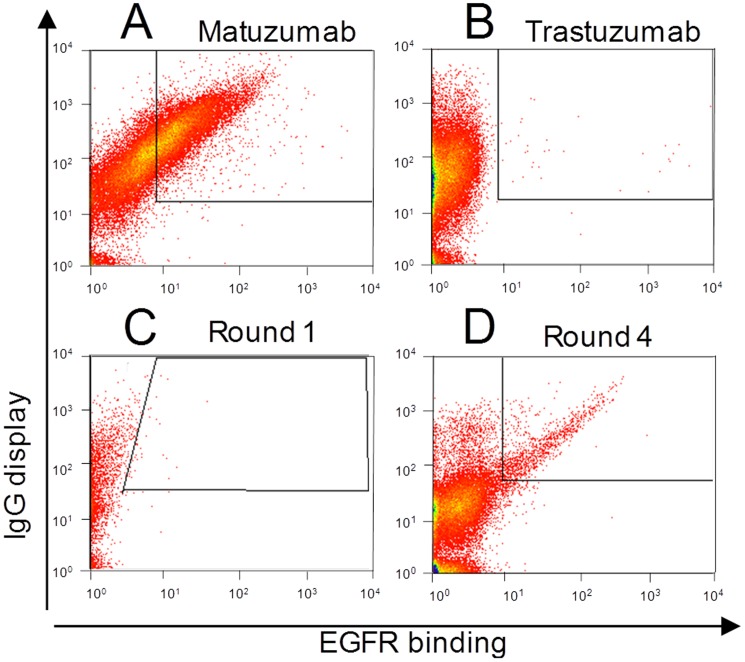
Figure 5. FACS analysis of REAL-Select enrichment of matuzumab-displaying cells.
Functionalized yeast cells displaying (A) matuzumab or (B) trastuzumab were mixed 1∶1,000,000 (C) and labeled using EGFR-PE and goat-anti-Fc F(ab′)2 AlexaFluor647. (C,D) FACS analysis of the cell population of sorting round 1 (C) and 4 (D) of FACS enrichment of matuzumab displaying cells.

