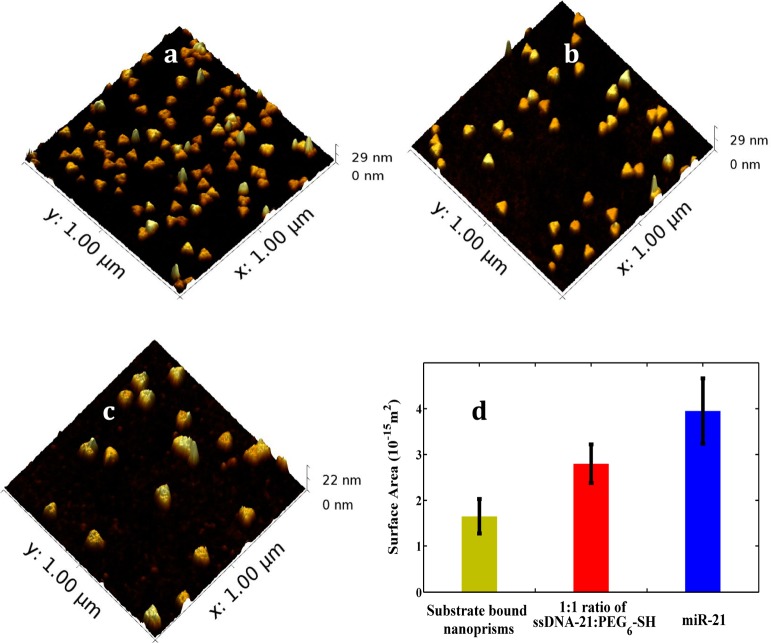
Figure 5.
Surface characterization of the plasmonic biosensors. Atomic force microscopy images of gold nanoprisms bound to silanized glass substrate (a) after functionalization with 1:1 ratio of HS-C6-ssDNA-21/PEG6-SH (b) and after hybridization with100 nM miR-21 in 40% human plasma (c). The measurements were conducted in air. (d) Changes in the surface area of gold nanoprisms after each functionalization steps. Forty nanoprisms were selected to determine the average change in the surface area. Detailed method of surface area calculation is provided in the Supporting Information file.

